

Table of Contents
Great systems are not just built. They are monitored.
MetricFire runs Graphite and Grafana as a fully managed service for growing engineering teams, taking care of storage, scaling, and version updates so your team doesn't have to. Plans start at $19/month, billed per metric namespace rather than per host, and include engineer-staffed support. Integrations work natively with Heroku, AWS, Azure, and GCP, and data is stored with 3× redundancy in SOC2- and ISO:27001-certified data centres.
Introduction
Redis is a widely used in-memory data store, commonly deployed as a cache, session store, message broker, or fast key-value database. Because Redis often sits on the critical path of an application, having visibility into its behavior (memory usage, client connections, command throughput, cache efficiency) is essential for troubleshooting and performance tuning.
In this guide, we’ll walk through connecting an existing Redis instance directly to Grafana as a datasource. We’ll focus on visualizing key operational metrics exposed by Redis using the INFO command and Grafana’s Redis datasource. This approach is well-suited for learning, exploration, and real-time visibility into Redis behavior. For long-term retention and alerting, we recommend collecting Redis metrics using Telegraf.
Getting Started
Prerequisites
This guide assumes:
- You already have a running Redis instance
- You have access to a Grafana account
- Redis is reachable from the Grafana environment (network and firewall rules allow access)
No Redis exporters or agents are required for this setup, but we're also including an optional guide for configuring the Telegraf agent to collect Redis metrics for long-term storage.
Allow External Access
Redis listens on port 6379 by default. If your server uses a firewall, allow access to this port so Grafana can connect (ubuntu):
sudo ufw allow 6379/tcp
sudo ufw reload
For testing purposes, this rule may be temporarily open. In production environments, access should be restricted using firewall rules, private networking, or authentication.
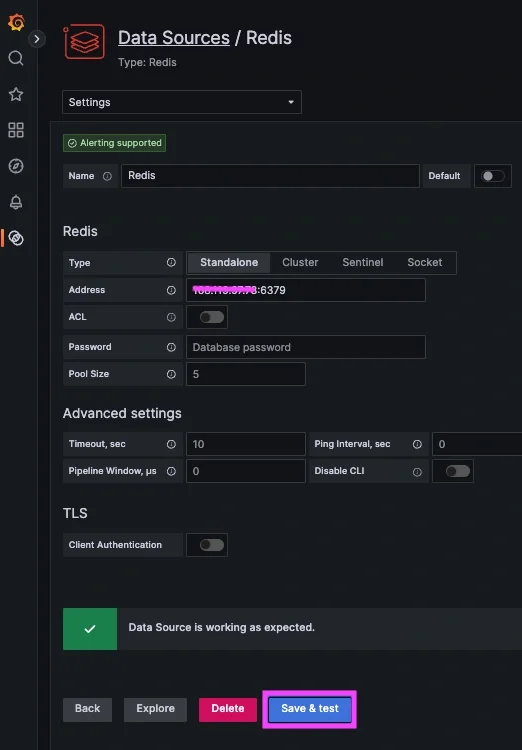
Connect Redis to Hosted Grafana
Navigate to your Grafana instance => Connect Data => search/select/install Redis:
- Type: Standalone
- Address: <server_ip>:6379
- Click "Save & Test"
If you don't already have a running instance of Grafana, you can get one for FREE when you start a 14-day trial with MetricFire!
Configure Telegraf to Collect Redis Metrics (optional)
If you want an easy way to forward system metrics to your running instance of Redis, Telegraf is probably the easiest way to accomplish that. Alternatively, for teams managing complex data pipelines across multiple sources, Integrate.io provides a low-code platform for ETL and data transformation that can help you collect and standardize metrics from Redis and other systems without heavy engineering overhead. If you don't already have an instance of Telegraf running on your server, you can install the HG-CLI tool to quickly install/configure Telegraf:
curl -s "https://www.hostedgraphite.com/scripts/hg-cli/installer/" | sudo sh
NOTE: You will need to input your Hosted Graphite API key and follow the prompts to select which metric sets you want.
Once it's installed, open the Telegraf configuration file at: /etc/telegraf/telegraf.conf and add the following section:
[[inputs.redis]]
  servers = ["tcp://localhost:6379"]
Now just save your updated conf file, and restart the Telegraf service. Or you can run Telegraf manually to inspect the output for potential syntax/permission errors:
telegraf --config /etc/telegraf/telegraf.conf
Telegraf will now continuously push system metrics to the Hosted Graphite backend.
Visualizing Redis Metrics in Grafana
Redis does not expose metrics as individual endpoints. Instead, operational metrics are returned as part of the Redis INFO command. Grafana parses this output and allows you to select individual fields for visualization.
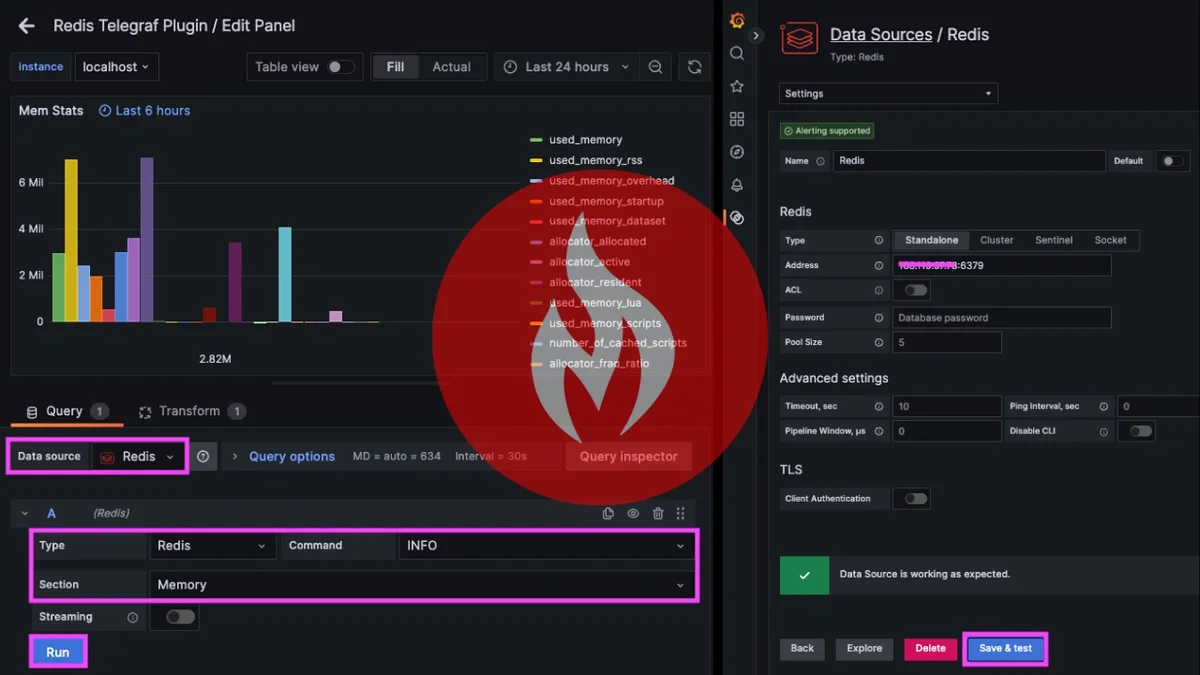
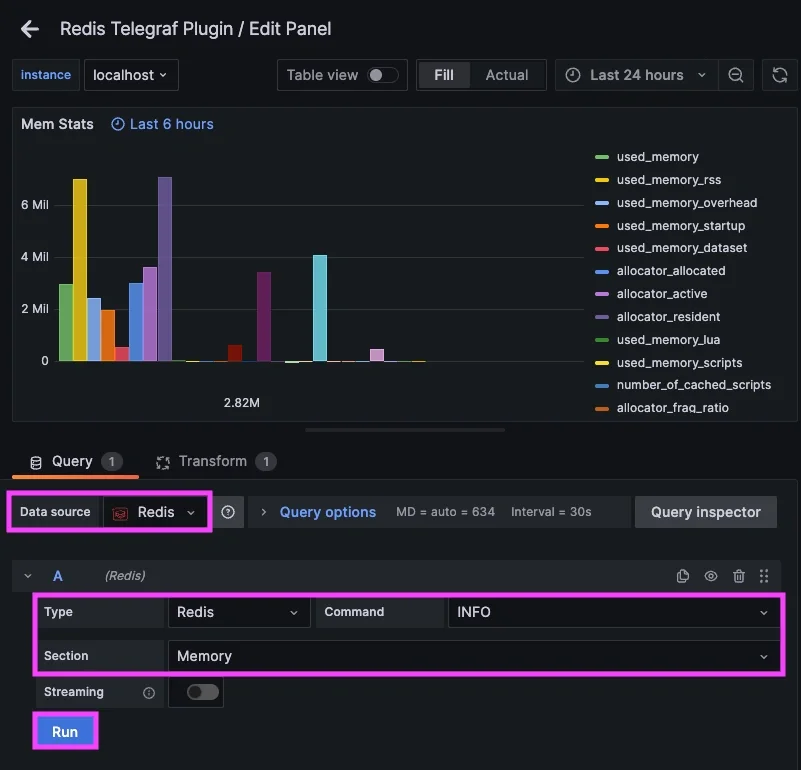
Add a Data Source Query (memory)
In your Grafana:
- Navigate to => Dashboards => New Dashboard => "Add new panel"
- Data source: Redis
- Type: redis
- Command: INFO
- Section: Memory
- Optionally use Transforms to include or exclude specific fields
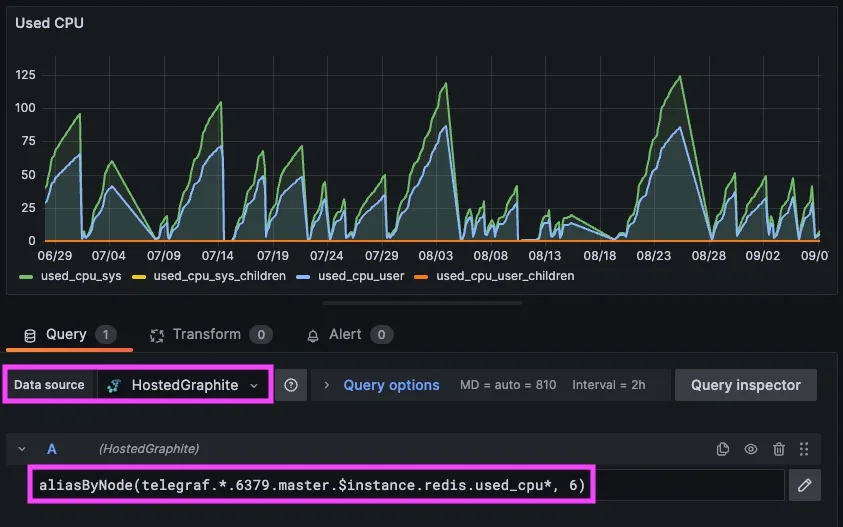
Add Telegraf Metric Query (cpu)
If you also configured Telegraf to collect Redis performance metrics, they are now being forwarded to your configured backend. If metrics are being forwarded to Hosted Graphite's storage backend, they are searchable in the HG Metrics Search UI and can be queried via the default HostedGraphite data source.
For more details on how to collect/visualize Redis metrics and logs, see our related article HERE.
Security Considerations
The Redis datasource connects directly to a running instance but in production environments, Redis should not be exposed publicly without authentication or network restrictions. Common production setups include:
- Restricting access via firewall rules or private networking
- Enabling Redis authentication or ACLs
- Collecting Redis metrics with Telegraf and storing them in Hosted Graphite for long-term retention and alerting
This guide intentionally focuses on a simplified configuration intended for testing and exploration.
Conclusion
Redis provides valuable operational signals that can be easily visualized using Grafana’s Redis datasource. By querying Redis INFO metrics directly, you can quickly gain insight into memory usage, client activity, command throughput, and cache efficiency without deploying additional agents or exporters.
This approach is ideal for real-time visibility and troubleshooting. For production monitoring, alerting, and historical analysis, we recommend collecting Redis metrics with Telegraf and storing them in Hosted Graphite. Together, these options give you flexibility in how you monitor Redis while maintaining a clean and scalable observability setup.
Sign up for the free trial and begin monitoring your infrastructure today. You can also book a demo and talk to the MetricFire team directly about your monitoring needs.


