
Table of Contents
Introduction
In this article, we will explore how we can monitor Elasticsearch instances with Graphite and visualize the data through Grafana. We will also focus on Graphite for monitoring our custom application metrics and displaying them together in a single dashboard in Grafana.
MetricFire offers Hosted Graphite, StatsD, and Grafana platform for monitoring time-series metrics. You can use this open-source software directly in the MetricFire web app, with no setup or hassle when it comes to scaling, updates, or plugins. You should sign up for the MetricFire free trial here and start monitoring your Elasticsearch instances now.
Key Takeaways
- Elasticsearch is a distributed open-source application for searching and analyzing data while Graphite is a popular open-source tool for gathering metrics and creating visualizations on top of the collected data.
- MetricFire provides a platform for monitoring time-series metrics and offers Hosted Graphite, StatsD, and Grafana.
- To set up instances of Graphite, Elasticsearch, and Grafana, one can use docker images available on Docker Hub.
- Elasticsearch metrics can be monitored using Grafana after pushing data into Graphite.
- Grafana can also be used to visualize Elasticsearch data, which is a powerful feature, and one can create visualizations based on the metrics of their interest in Elasticsearch.
Introduction to Graphite
Graphite is a popular open-source tool for gathering metrics and creating visualizations on top of the collected data. It consists of three components: Carbon, Graphite Web, and Whisper. In this article, we will not go into details about Graphite. For a more detailed introduction to Graphite, refer to our articles such as Graphite and Grafana, Monitoring with Graphite: Installation and Setup, and Monitoring with Graphite: Architecture and Concepts.
Introduction to Elasticsearch
Elasticsearch is a distributed open-source application for searching and analyzing data. Its main powerful feature is its full text search engine, which is based on Lucene query language. Elasticsearch is based on an inverted index data structure which allows for very fast full text searching. Thus it is vastly used in use cases such as application and website search, logging, and log analytics.
Setting Up Graphite, Elasticsearch, and Grafana
To set up instances of Graphite, Elasticsearch, and Grafana, we will use docker images available on Docker Hub.
We will also use 3 additional docker images:
- es2graphite - This container will query our Elasticsearch cluster and push the Elasticsearch metrics to Graphite.
- collectd-write-graphite - This container will query our host and push the metrics to Graphite.
- dejavu - The out-of-the-box installation of Elasticsearch does not come with any graphical User Interface. dejavu provides the Graphical user interface on top of the Elasticsearch API. We will use this Graphical User Interface to import the sample data later in the section.
Below is the sample docker-compose.yml which will instantiate the above containers and get the Graphite, Elasticsearch, and Grafana, ready to use.
version: "3"
services:
  grafana:
    image: grafana/grafana
    ports:
      - 3000:3000

  graphite-statsd:
    image: graphiteapp/docker-graphite-statsd
    ports:
      - 2003-2004:2003-2004
      - 2023-2024:2023-2024
      - 8125:8125/udp
      - 8126:8126
      - 8080:80

  elasticsearch:
    image: docker.elastic.co/elasticsearch/elasticsearch-oss:7.0.1
    container_name: elasticsearch
    environment:
      - discovery.type=single-node
      - http.port=9200
      - http.cors.enabled=true
      - http.cors.allow-origin=http://localhost:1358,http://127.0.0.1:1358
      - http.cors.allow-headers=X-Requested-With,X-Auth-Token,Content-Type,Content-Length,Authorization
      - http.cors.allow-credentials=true
      - bootstrap.memory_lock=true
      - "ES_JAVA_OPTS=-Xms512m -Xmx512m"
    ports:
      - "9200:9200"
      - "9300:9300"
    # elasticsearch browser
  dejavu:
    image: appbaseio/dejavu:3.2.3
    container_name: dejavu
    ports:
      - "1358:1358"
    links:
      - elasticsearch

  es2graphite:
    image: logzio/es2graphite
    environment:
      - ELASTICSEARCH_ADDR=elasticsearch
      - GRAPHITE=graphite-statsd
      - GRAPHITE_PREFIX=PROD.Elasticsearch

  collectd-write-graphite:
    image: andreasjansson/collectd-write-graphite
    environment:
      - HOST_NAME=elasticsearch
      - GRAPHITE_HOST=graphite-statsd
After running this docker-compose script using “docker-compose up -d”, we should be able to access each of the containers.
First, browse to http://localhost:3000/ to make sure you are able to access Grafana. Use the credentials admin/admin to get into the Grafana dashboard.
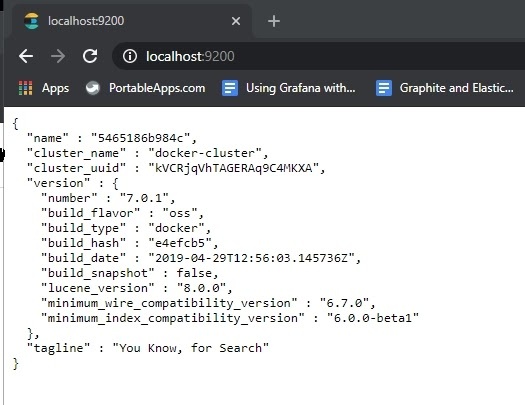
Also, we should be able to verify that Elasticsearch is up and running by browsing http://localhost:9200. We should see a similar output below:
Remember, if you want to skip the install and configuration, you can always use MetricFire's Hosted Graphite. Get the free trial here and check it out. The MetricFire platform has Graphite and Grafana ready to go, with easy plugins and agents for collecting metrics from any data source.
Monitoring Elasticsearch metrics using Grafana
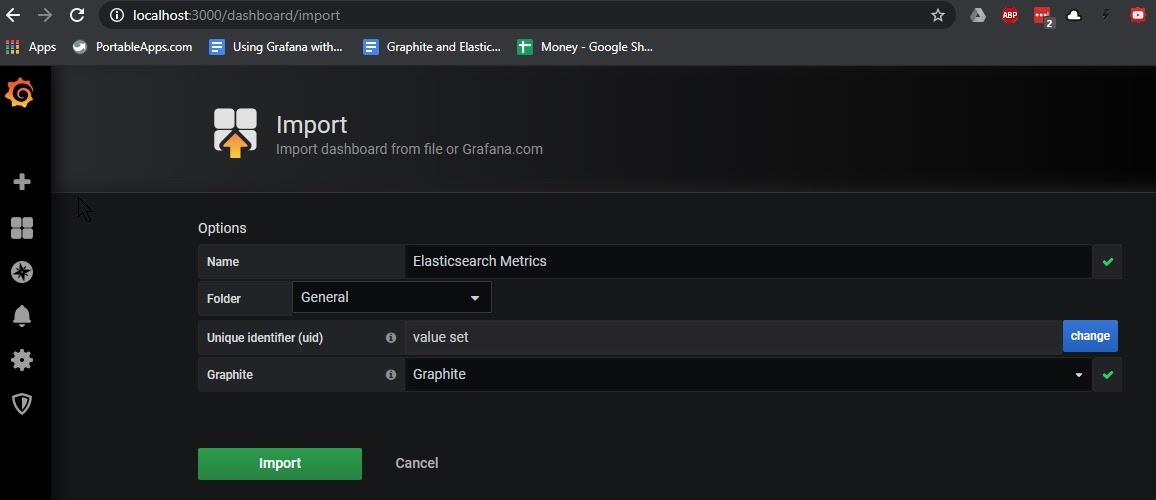
At this time, our containers have started pushing Elasticsearch metrics into Graphite. We will use Grafana to plot the visualizations from the metrics that reside in Graphite. Hence, browse to http://localhost:3000 and import the Elasticsearch metrics dashboard into Grafana as shown below:
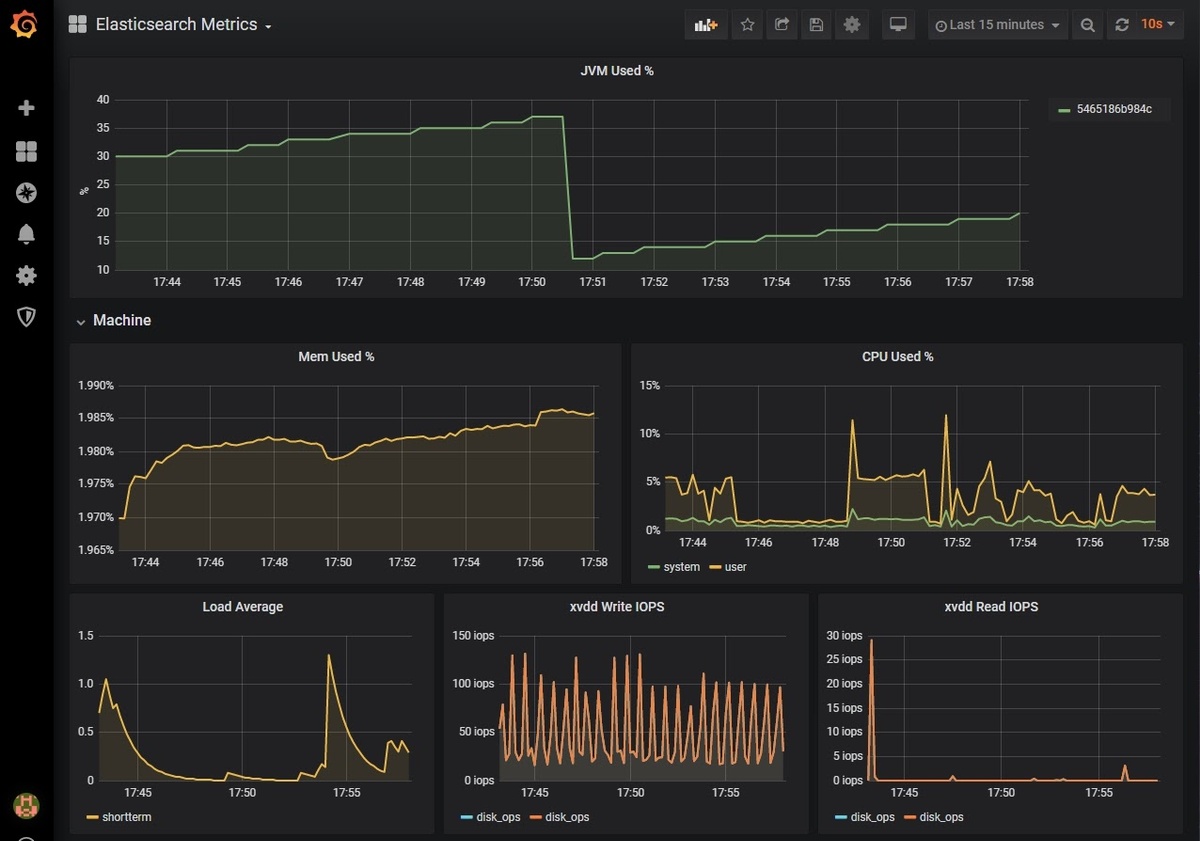
Once imported, we should be able to see the Elasticsearch metrics on our Grafana dashboard.
Host JVM / CPU and Memory Metrics:
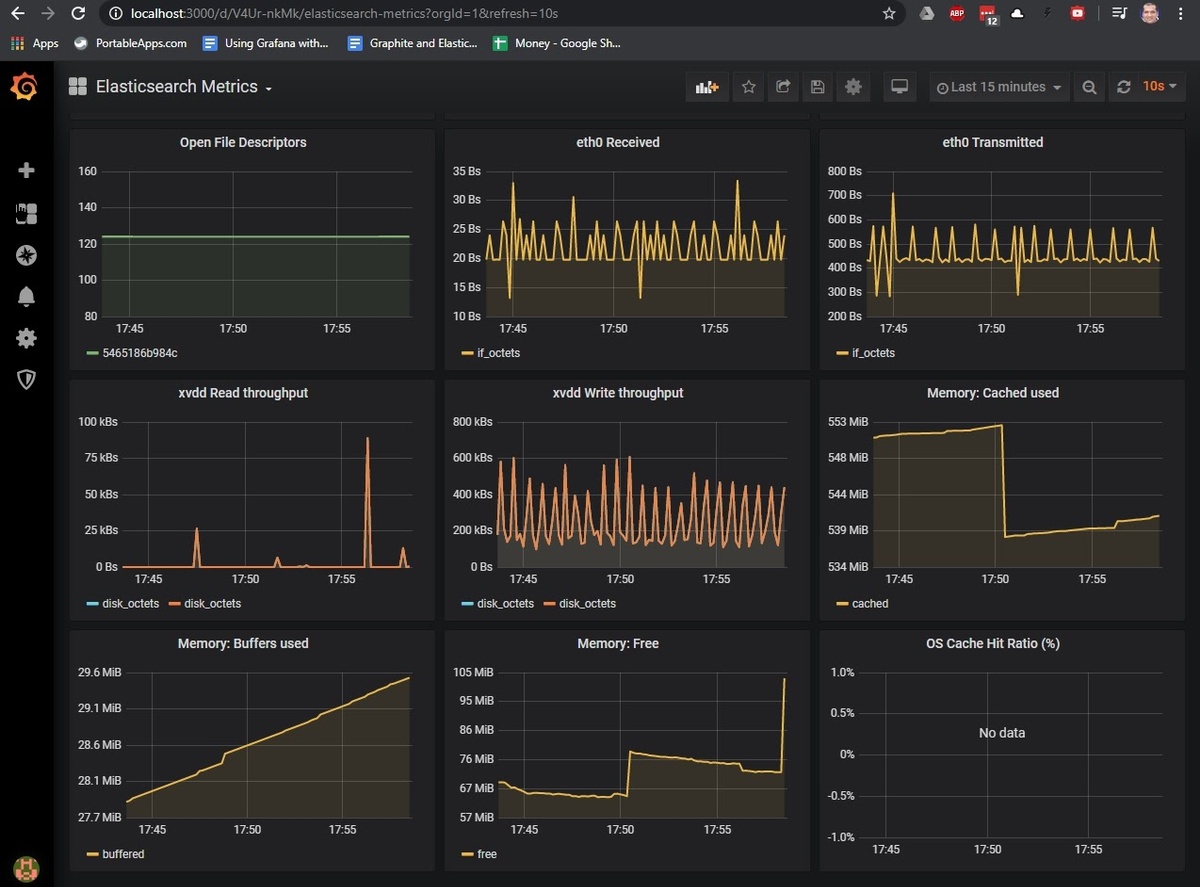
Elasticsearch Metrics:
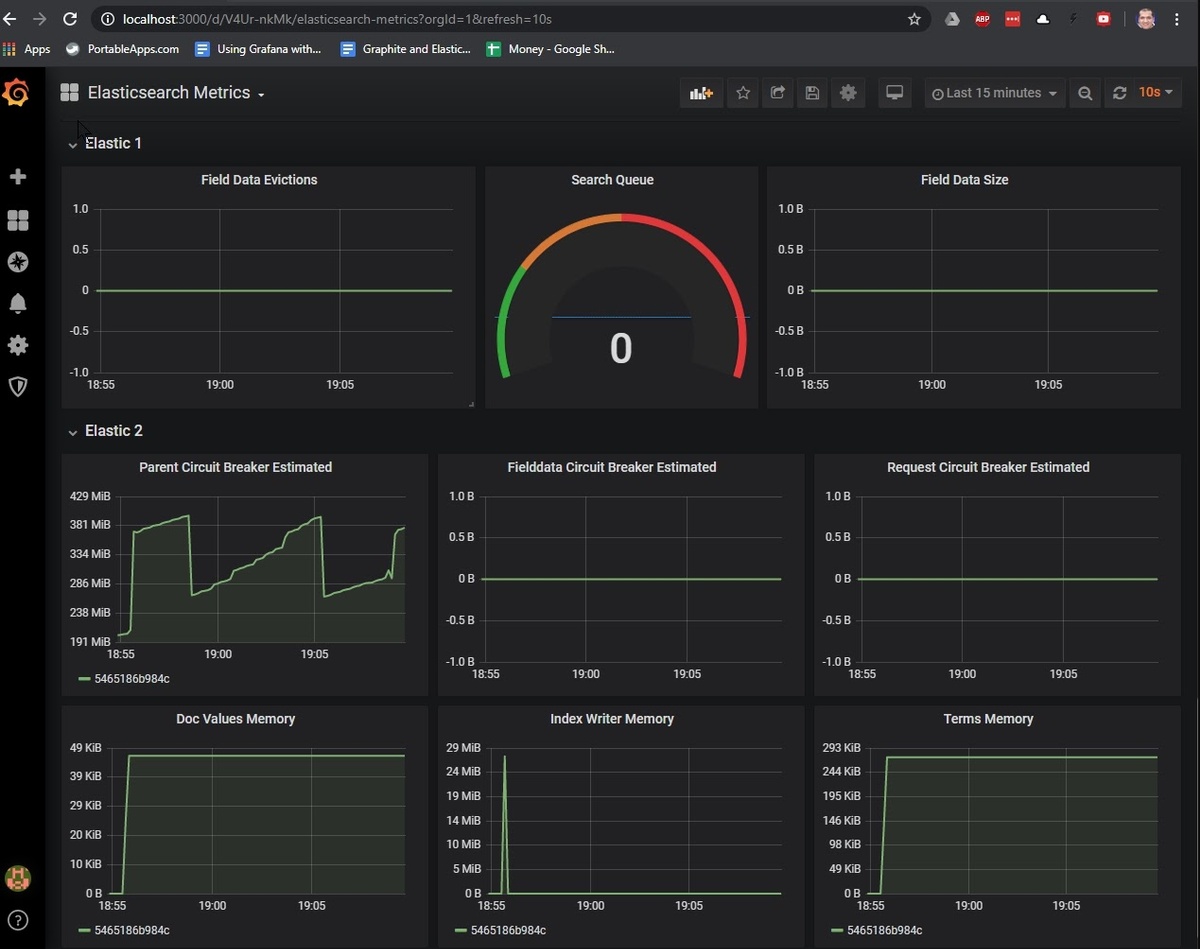
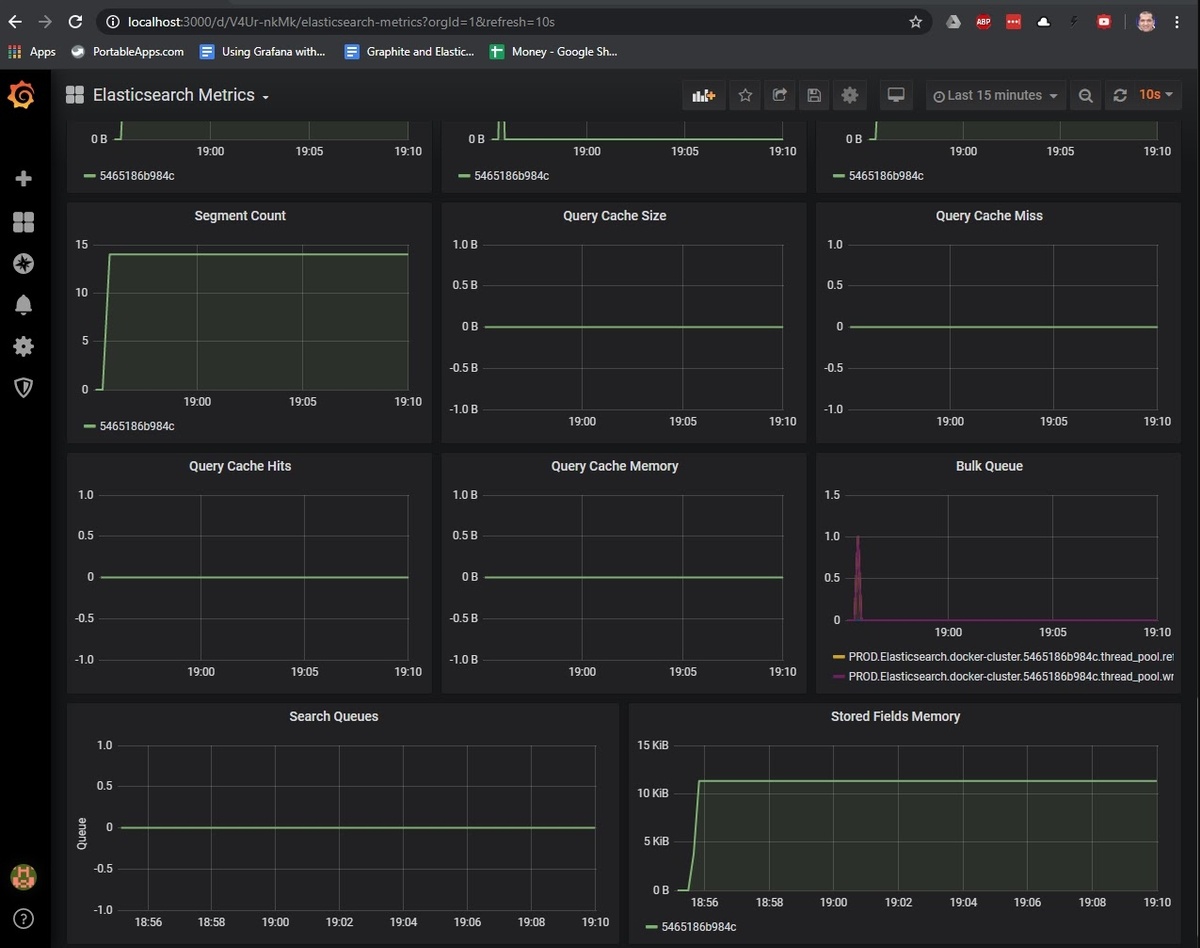
Realtime Search Metrics:
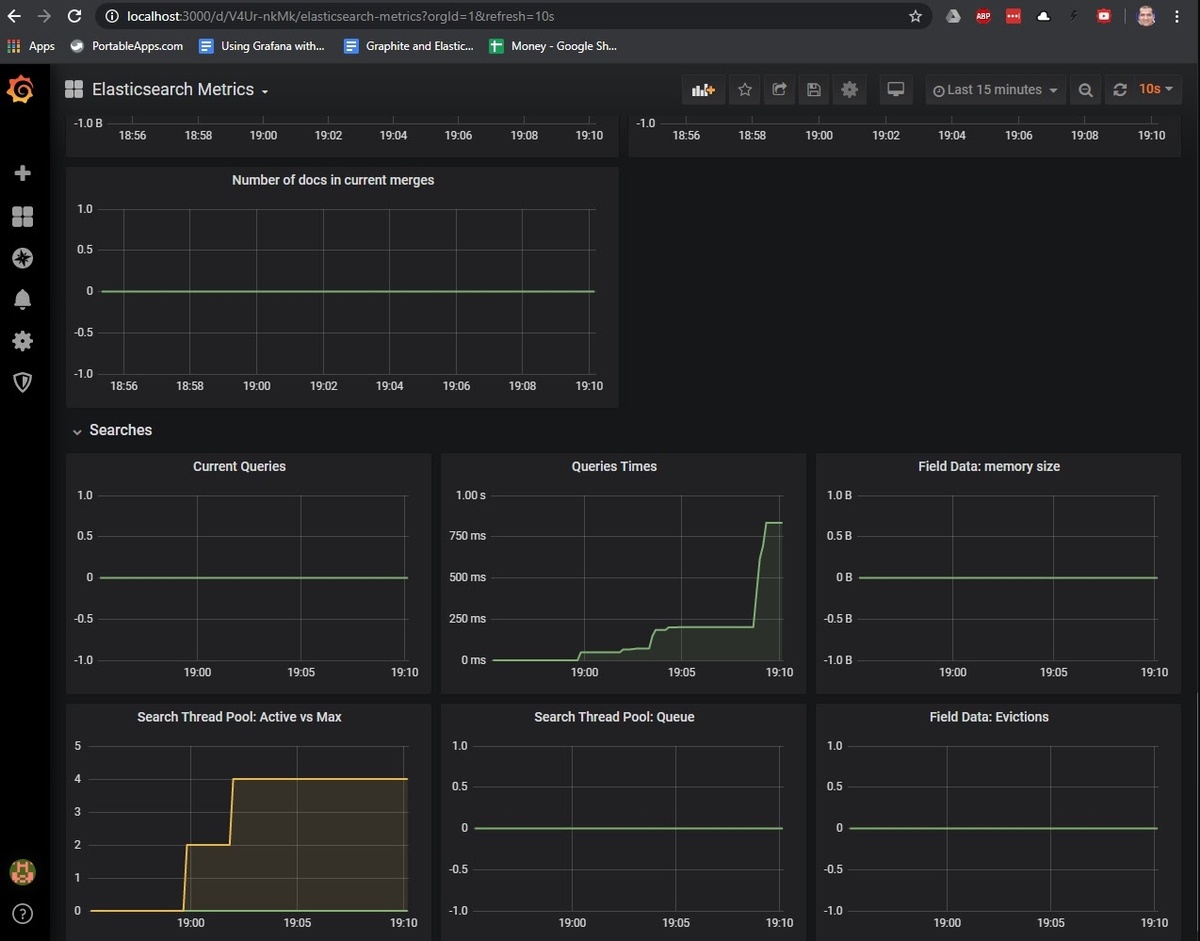
The metrics we see in the above dashboard are just a subset of what is available to be monitored. Each organization would have a different set of metrics to be monitored depending on its requirements. If you want to create more Grafana dashboards based on these metrics, check out our article Grafana Dashboards from Basic to Advanced dashboards to learn how to set up Grafana alerts, and build custom dashboards.
You can also create other types of visualizations based on the metrics of your interest in Elasticsearch. Have a look at the article Our Favorite Grafana Dashboards to create some of the more advanced dashboards.
Visualizing Elasticsearch Data on Grafana
Till now, we have seen how to monitor Elasticsearch data by pushing data into Graphite. We will now see how to visualize the data residing in Elasticsearch in Grafana. This is a very powerful feature of Grafana because it allows you to visualize your application data on Grafana.
For example, if you are storing daily transaction data inside Elasticsearch, you could visualize transactions per day in a matter of a few seconds. For this purpose, we will import a sample data set into our Elasticsearch instance using dejavu and then connect Grafana to the Elasticsearch data source.
First, let’s import the sample data into Elasticsearch. We’ll simply follow the steps on the official Elasticsearch site to load logs.json data into Elasticsearch.
Specifically, we will execute the following commands:
We will download the logs.jsonl file from the Elastic servers:
curl -O https://download.elastic.co/demos/kibana/gettingstarted/7.x/logs.jsonl.gz
Gunzip the file:
gunzip logs.jsonl.gz
And finally, upload to our Elasticsearch instance:
curl -H 'Content-Type: application/x-ndjson' -XPOST 'localhost:9200/_bulk?pretty' --data-binary @logs.jsonl
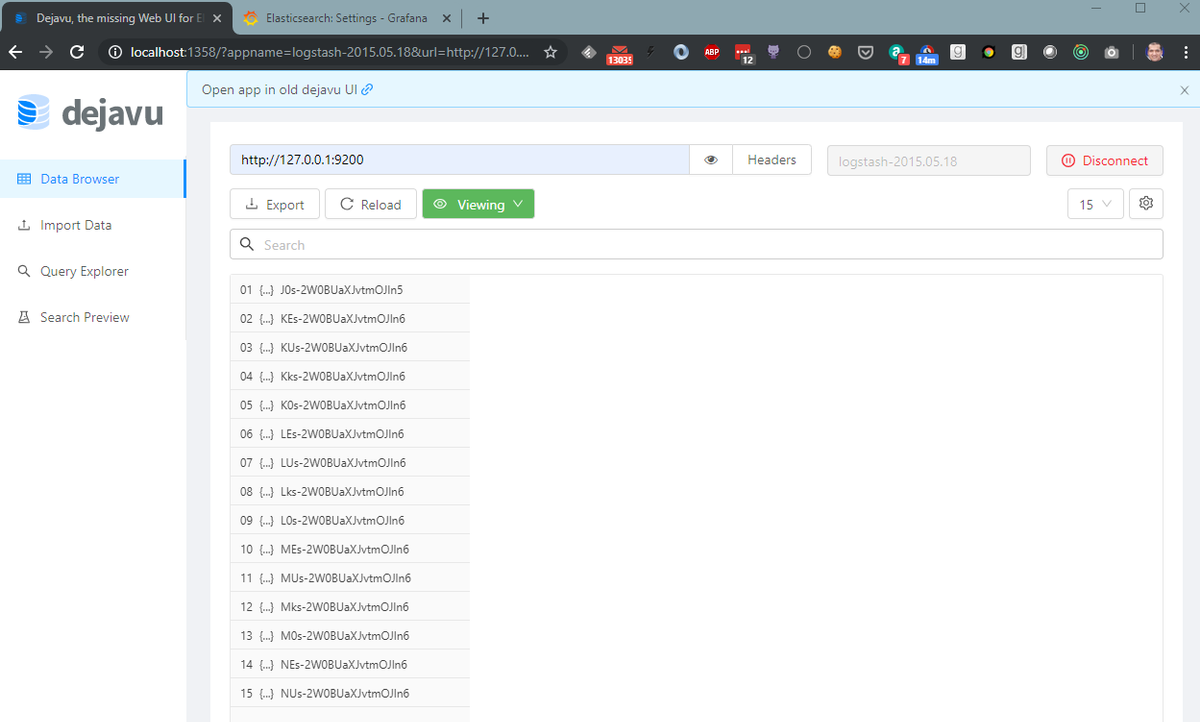
We can confirm the data load by connecting the dejavu UI to http://127.0.0.1:1358 and logstash-2015.05.18 index:
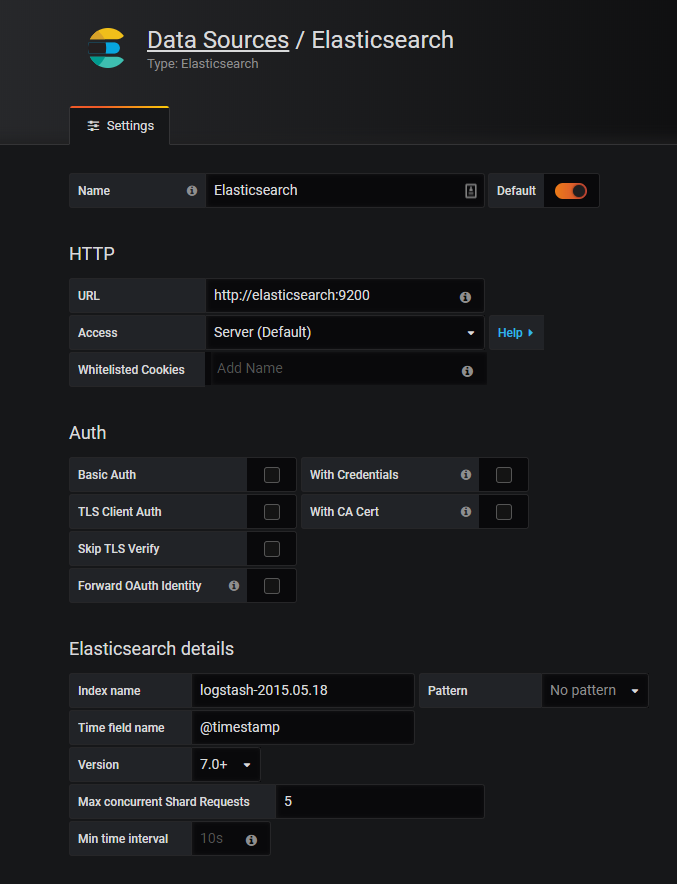
Now, we will add our Elasticsearch cluster as the data source into Grafana and create visualizations of the data residing in it.
Browse to Grafana at http://localhost:3000 and add a data source of the type Elasticsearch as shown below:
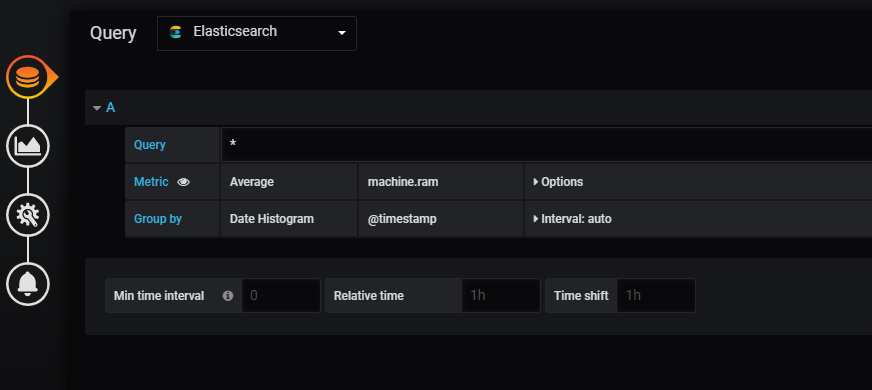
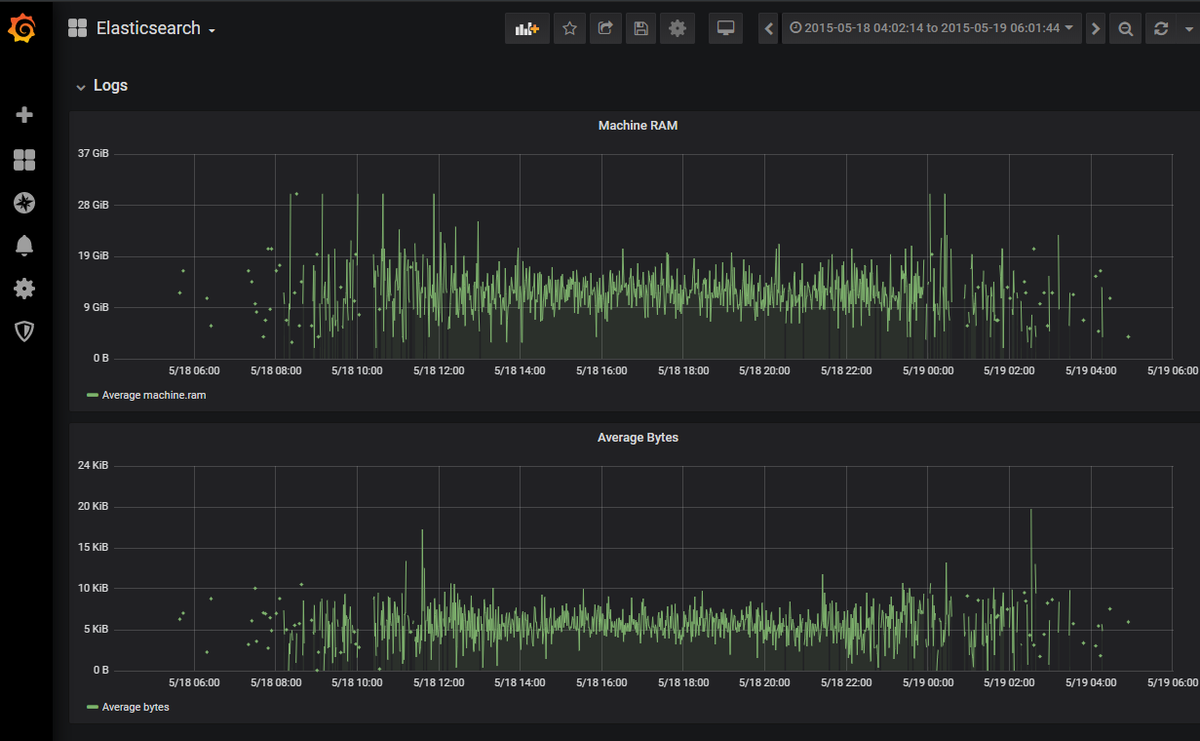
Now, we will create a new dashboard to plot the Average Machine RAM from our data source. Choose, Add dashboard and add the graph visualization. In the query dropdown box, choose Elasticsearch as the data source, and we will use machine.ram as the average metric as shown below:
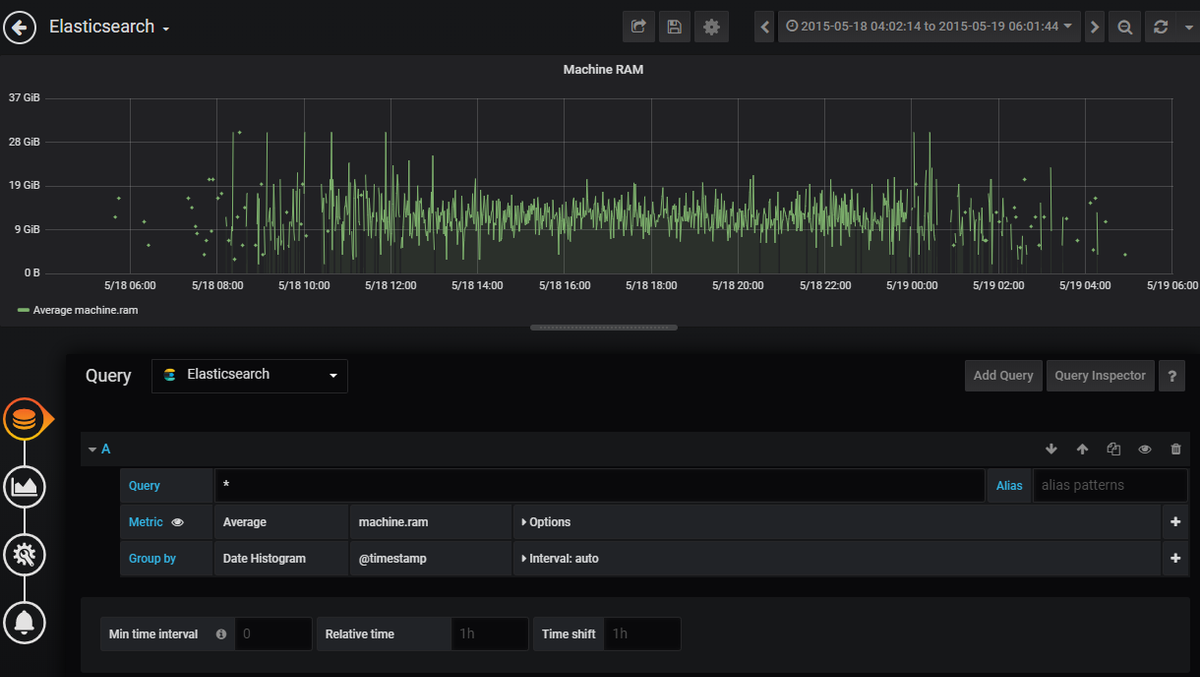
Save the visualization and we will choose the custom time range in the top right box. This is because our log data contains entries from the month of May 2015. Configuring to this time range gives us the following visualization:
Similarly, we will add the visualization for Average Bytes and our Grafana dashboard will look like this:
Conclusion
In this article, we have seen how to monitor Elasticsearch instances using Graphite and Grafana. We also saw how to visualize application data residing inside Elasticsearch in Grafana.
MetricFire also provides production-ready Hosted Graphite and Hosted Grafana along with many other benefits so that users can focus on building their applications, and let MetricFire take care of managing the scalability and storage of their metrics.
Sign up for the MetricFire free trial to set up Graphite and build Grafana dashboards now. You can also book a demo and talk to the MetricFire team about how you can best set up your monitoring stack.


