
Table of Contents
- Introduction
- Key Takeaways
- About Google Cloud Platform
- Getting Started with Google Cloud Platform
- Getting Started with Grafana
- Getting Started with Google Cloud SQL
- Setting up Monitoring for Cloud SQL
- Integrating Cloud SQL with Graphite and Grafana
- Using Google Stackdriver Data Source in Grafana
- Conclusion
Introduction
In this article, we are going to see how we can integrate Google Cloud with Grafana. We will integrate Google Cloud SQL with Grafana and plot the metrics on Grafana. We will also look at how we can use Google Stackdriver as the data source in Grafana to expose the metrics of Google Cloud VMs and platforms.
To use Grafana immediately, we will be using Hosted Grafana by MetricFire. Hosted Grafana by MetricFire allows you to import your GCP metrics immediately into a Graphite back-end with Grafana dashboards. MetricFire is low-cost and is built for scaling - MetricFire is a great solution for expanding your metrics monitoring and getting more out of monitoring.
All you need to do to use Hosted Grafana by MetricFire is sign up for the free trial. Get into the product and try and out!
You don’t need to have fully functional cloud services running with Google Cloud to understand this article, but it does assume that you have basic familiarity with Google Cloud.
Key Takeaways
- The article discusses how to integrate Google Cloud services with Grafana for effective monitoring and visualization of metrics.
- The article provides step-by-step guidance on getting started with Google Cloud Platform, Grafana, and Google Cloud SQL.
- Google Cloud SQL, a relational database service, is provisioned and configured to collect health metrics, which are then visualized in Grafana.
- Detailed instructions are given for integrating Cloud SQL with Grafana, including importing pre-made Grafana dashboards for visualizing metrics.
- Grafana's built-in support for Google Stackdriver as a data source is explained, along with the process of creating a service account in Google Cloud for integration.
About Google Cloud Platform
Google Cloud is one of the most popular platforms for building and deploying cloud applications. Google Cloud provides all the major features of cloud services such as Compute Engine, Storage, Containers, Virtual Machines, Cloud Storage, Virtual Private Cloud, Load Balancing, Content Delivery Network (CDN), Domain Name Service (DNS), Big Data, Queue Messaging and much more. Launched in 2008, Google Cloud has multiple data centers around the world.
Getting Started with Google Cloud Platform
If you have not done so already, sign up for a new Google Cloud account at Google Cloud Console. Google Cloud offers 3 months free with $300 worth of free credits to try out its products.
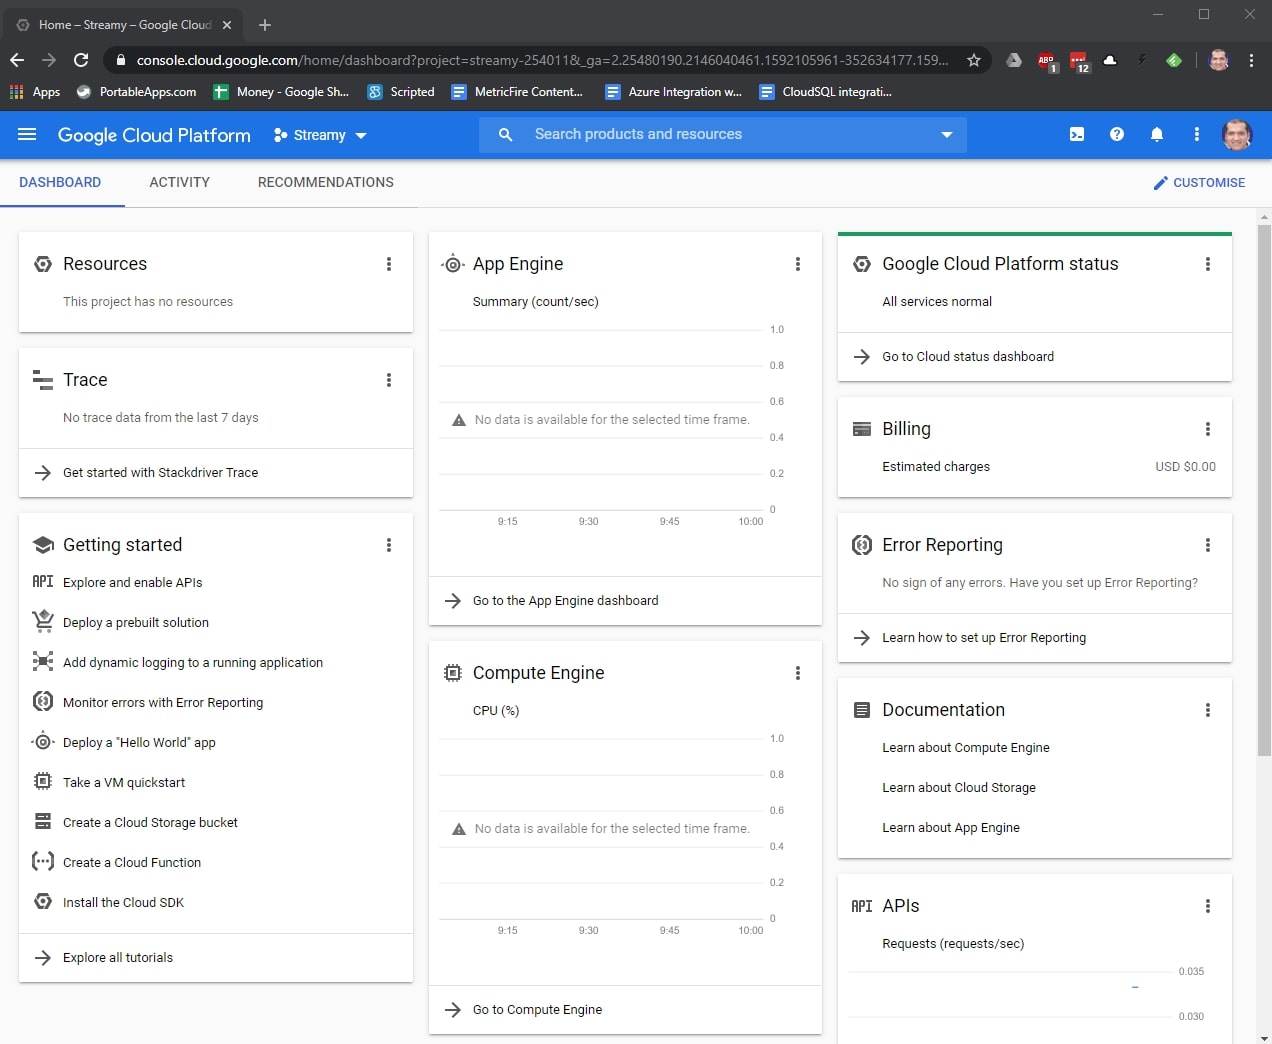
Once signed up and logged in, we are presented with the following Google Cloud Console homepage showing the overview of all the services that we are using. In our case, it's mostly empty as we have not started using any of its services yet.
Getting Started with Grafana
We will now provision Grafana and import our Google Cloud metrics. To check out how to get up and running with Grafana, go to our Getting Started with Grafana docs page.
Setting up Grafana with MetricFire is the easiest way to get Grafana running. All you have to do is head into the free trial, set up your data source, and you’re good to go! The MetricFire docs explain exactly how to use add-ons to make it easier to integrate with GCP.
Next, we will provision Google Cloud SQL to monitor its health on the Grafana dashboard.
Getting Started with Google Cloud SQL
Cloud SQL is a relational database service offered by Google Cloud. It offers seamless replication and scalability so that users don't have to worry about those aspects while creating applications.
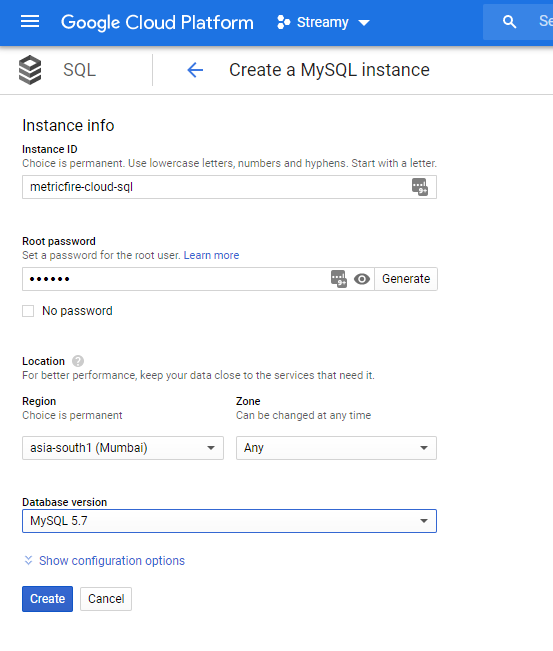
To provision a Cloud SQL instance, let’s head over to the SQL section and provision a Cloud SQL instance. Make sure to provide an Instance ID and a strong password, and select the region that is the closest to your geography. We can keep the database version as MySQL 5.7.
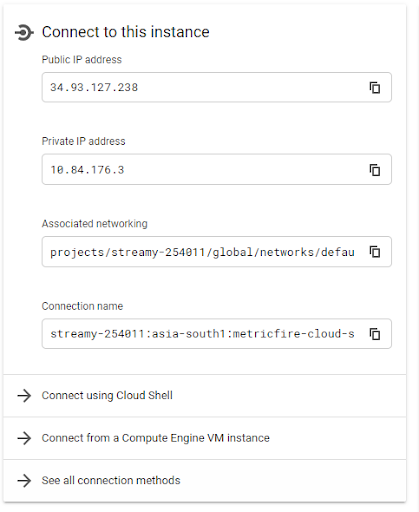
Once the Cloud SQL is provisioned, we will be able to see both public and private IPs allocated to this instance.
Setting up Monitoring for Cloud SQL
Now our Cloud SQL instance is provisioned. We will configure it to make sure it is able to collect health metrics which we will be pulling in Grafana.
For this, we need to run the statistics collection agent on MySQL. We will be using the open-source library my2Collector for this purpose. Simply connect to the MySQL instance provisioned above and run the following command to install the agent.
mysql --user=root -pXXX < my2.sql
Integrating Cloud SQL with Graphite and Grafana
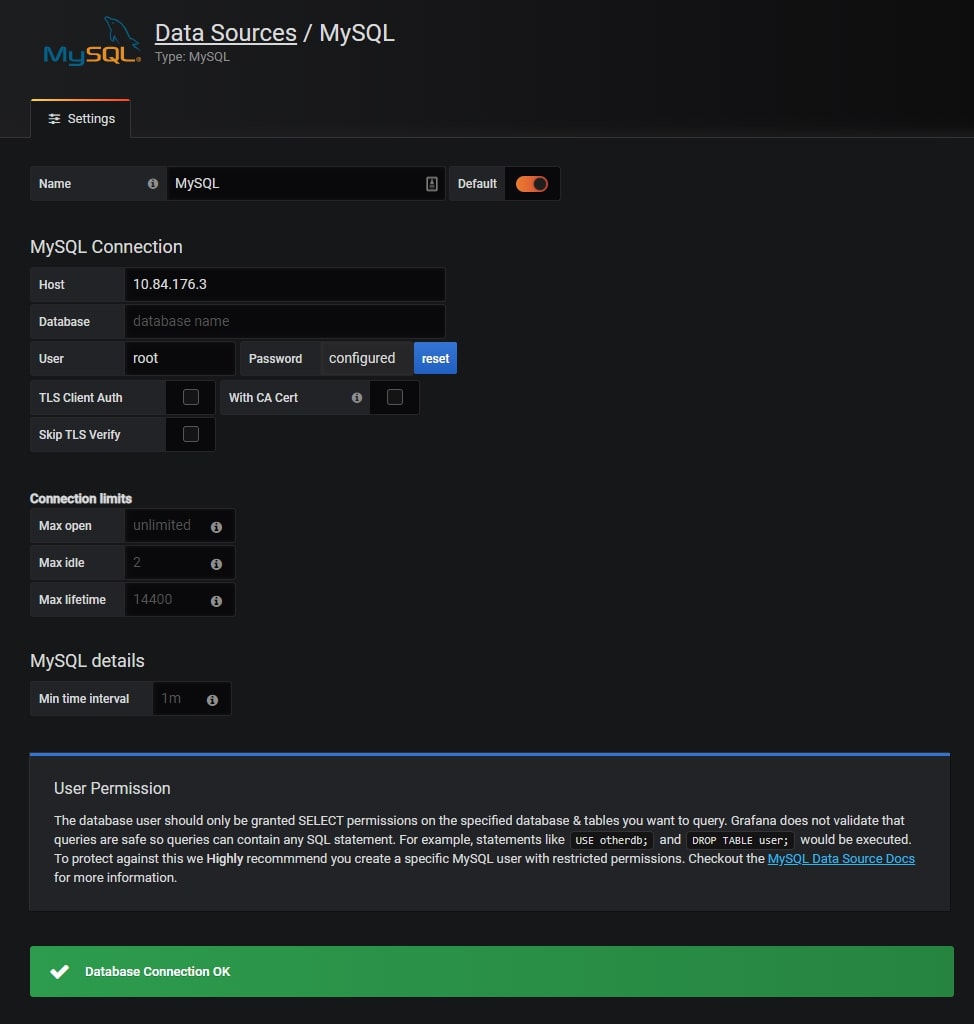
Now our Cloud SQL instance is ready and storing health metrics. It's time to switch to Grafana and configure our visualizations. Browse to the Grafana Url which we provisioned earlier and add a new MySQL data source as shown below.
MySQL Host IP Address will be the IP Address of our Google Cloud SQL instance which we provisioned in the earlier step. Specify the username and password that were specified for the Cloud SQL instance and hit Save.
Now the data source is added and it is time to configure the visualizations. Instead of creating our own dashboard from scratch, we will rely on the Grafana dashboard library to import the MySQL dashboard and customize it according to our needs. Click on the Download JSON link and import the dashboard into the Grafana.
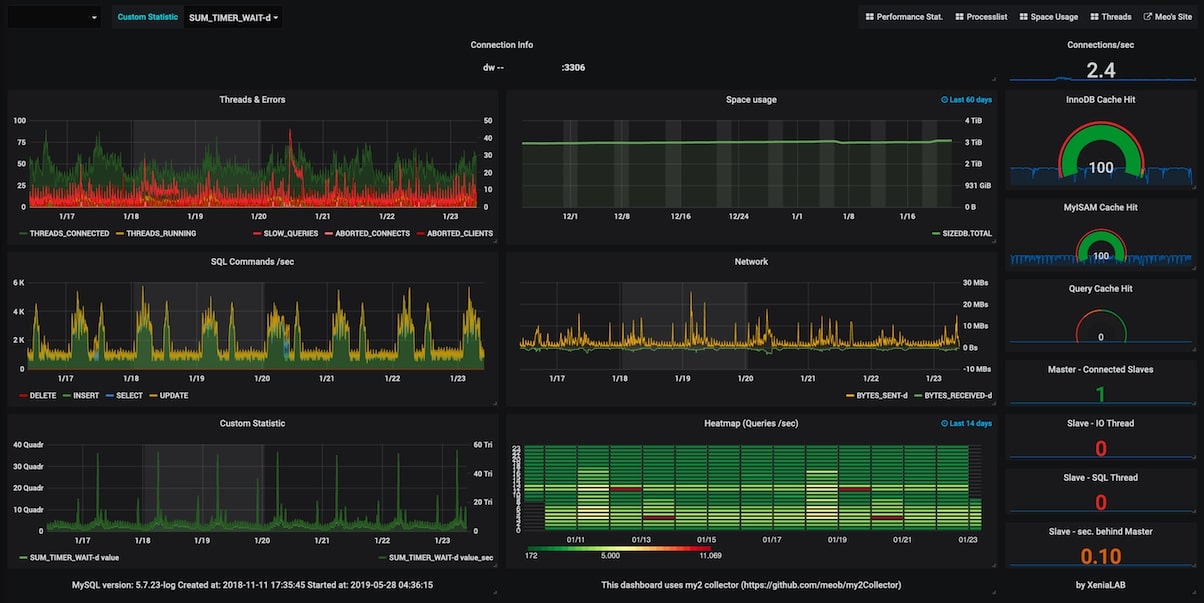
Once imported, you should see the statistics and health metrics related to the Cloud SQL instance such as Threads and errors, Space Usage, SQL Commands/sec/Network, Queries/sec, Connections/sec, Query Cache Hit, and others.
You can also set alerts on these dashboards if the value of the observed metrics falls out of the allowed range. For more information on how to create such advanced dashboards, have a look at our articles on Grafana Dashboards from Basic to Advanced Dashboards and Our Favorite Grafana Dashboards.
Using Google Stackdriver Data Source in Grafana
Google Stackdriver is the monitoring engine for applications hosted in Google Cloud. It offers metrics collection, log management, application performance management, and out-of-the-box dashboards and views to monitor the Google Cloud-hosted platform and applications.
However, Google Cloud Stackdriver’s visualization and customization are not as powerful as Grafana's. That’s why many users prefer Grafana as their monitoring and visualization solution even though Stackdriver is built-in into Google Cloud.
The other aspect is that Grafana and Graphite are open source solutions that can be customized openly whereas Google Stackdriver comes under the category of proprietary software.
Grafana ships with out-of-the-box support for Stackdriver as the data source. The process to integrate Stackdriver with Grafana is fairly straightforward. First, we need to create a service account for our Google Cloud project. Once the service account file is generated, we can go to Grafana and upload it under the Stackdriver Datasource configuration.
For more detailed instructions, have a look at the article “Introducing Stackdriver as a data source for Grafana” in Google Cloud. These instructions are also available in Grafana documentation.
Conclusion
In this article, we saw how we can integrate our applications hosted in Google Cloud into Grafana. We also saw how to push metrics from the Google Cloud SQL instance to Grafana and plot them into the dashboard.
MetricFire provides production-ready Hosted Graphite and Hosted Grafana which comes with this and a lot of other features that make monitoring GCP applications absolutely seamless.
Sign up for the MetricFire free trial to set up Graphite and build Grafana dashboards now. You can also book a demo and talk to the MetricFire team about how you can best set up your monitoring stack.


