
Table of Contents
Great systems are not just built. They are monitored.
MetricFire runs Graphite and Grafana as a fully managed service for growing engineering teams, taking care of storage, scaling, and version updates so your team doesn't have to. Plans start at $19/month, billed per metric namespace rather than per host, and include engineer-staffed support. Integrations work natively with Heroku, AWS, Azure, and GCP, and data is stored with 3× redundancy in SOC2- and ISO:27001-certified data centres.
Introduction
Your Mac’s GPU is a massively parallel processor that handles anything from animating the UI to heavy lifting in video editors, 3D tools, games, and on-device machine learning models. Think Final Cut Pro exports, Blender renders, Stable Diffusion, WebGPU demos, or shader builds in Xcode - which are all tasks that require a heavy GPU.
When the GPU is busy, a few practical things follow, like the battery drains faster, and the machine runs hotter. When the temperatures of your machine climbs, macOS can throttle clocks to protect the hardware, but monitoring the GPU gives you visibility into those tradeoffs. If you see high utilization with dropping frequency and rising temperature, that’s classic throttling. If power spikes at idle, maybe a background app is quietly using the GPU. With a few simple metrics, you can correlate “the laptop feels sluggish” with real numbers to identify the root cause, rather than guessing. This is where Macmon and Hosted Graphite come in to give you better visibility into your operating system.
Want to understand what your Macmon GPU metrics really mean? This guide walks you through installing Macmon, streaming GPU data, and analyzing Apple Silicon performance using MetricFire’s Hosted Graphite.
Use MetricFire's Hosted Graphite platform to analyze your system's performance and troubleshoot errors. Book a demo with our team for more detailed information about MetricFire and how to integrate it with your system; sign up for a MetricFire free trial to get started with seeing your GPU’s vital signs.
Step 1: Install Macmon on macOS
Macs with Apple Silicon (M1/M2/M3) put the CPU, GPU, Neural Engine, and media blocks on a single system on a chip (SOC) that shares high-bandwidth unified memory. That integrated GPU isn’t just for drawing the desktop; it’s an efficient compute device optimised for Metal and high performance per watt. Video editors lean on it for effects and exports, 3D apps push it for rendering, machine learning frameworks can offload kernels, and even browsers can exercise it via WebGPU. Because power, clocks, and thermals are all managed dynamically on the same chip, watching GPU metrics tells you when you’re compute-bound, memory-bandwidth-bound, or simply thermally throttled.
macmon streams these Apple-Silicon stats as newline-delimited JSON without sudo, kexts, or privileges. It exposes GPU power, frequency and utilization, temperatures, and memory fields, which are exactly what we need for meaningful performance monitoring. Just install it with Homebrew (as well as jq for JSON parsing):
brew install macmon jq
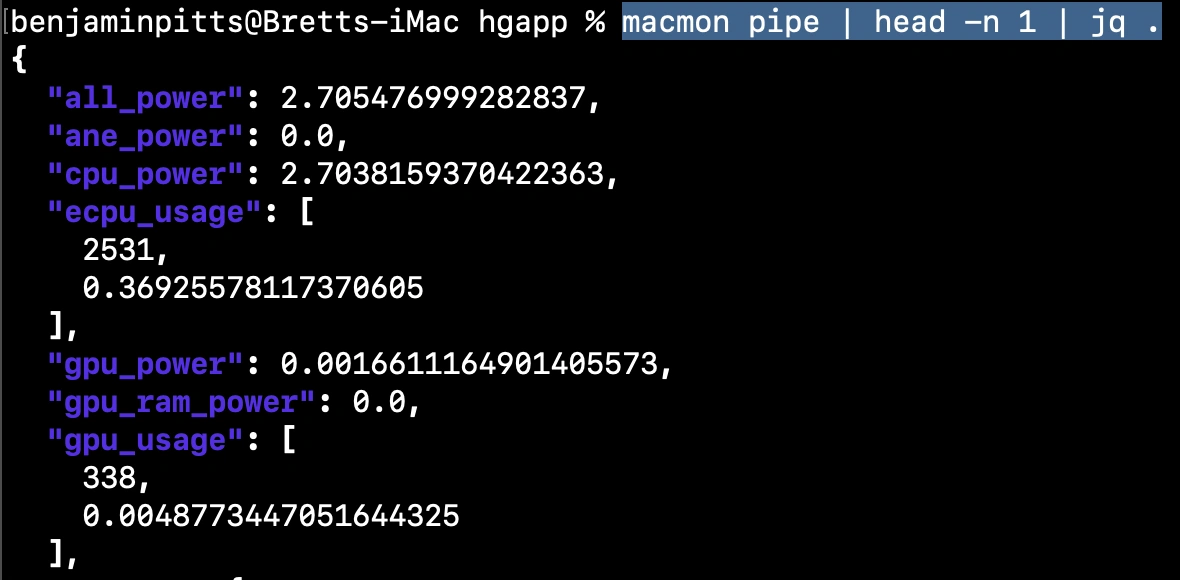
Confirm that macmon is collecting metrics from your macOS with the following command (you'll see keys like gpu_power, gpu_usage, temp.gpu_temp_avg):
macmon pipe | head -n 1 | jq .
Step 2: Forward Macmon GPU Metrics to Hosted Graphite
You can easily send your macmon GPU metrics to Hosted Graphite using a lightweight Bash script. macmon emits newline-delimited JSON, but Graphite expects simple plaintext lines in the form metric.name numeric-value [timestamp]. So we need a tiny bit of parsing to turn JSON fields (like gpu_power, gpu_usage) into Graphite lines, which is exactly what this script does. It reads one JSON sample from macmon, extracts a handful of metrics with jq, forwards them to Hosted Graphite’s public carbon endpoint using the netcat utility, sleeps 5 minutes, and repeats. It’s intentionally minimal with no retries, fancy batching, and just enough to get data flowing to an easy-to-use storage backend.
Create a new Bash file named macmon-metrics.sh and include the below script:
#!/bin/bash

apikey="<YOUR-HG-API-KEY>"
prefix="$apikey.macmon-metrics"

while true; do
  macmon pipe | jq -c '.' | while read -r line; do
    ts=$(echo "$line" | jq -r '.timestamp')

    # Top-level system metrics
    all_power=$(echo "$line" | jq -r '.all_power')
    echo "$prefix.all_power $all_power" | nc carbon.hostedgraphite.com 2003
    ane_power=$(echo "$line" | jq -r '.ane_power')
    echo "$prefix.ane_power $ane_power" | nc carbon.hostedgraphite.com 2003
    cpu_power=$(echo "$line" | jq -r '.cpu_power')
    echo "$prefix.cpu_power $cpu_power" | nc carbon.hostedgraphite.com 2003
    gpu_power=$(echo "$line" | jq -r '.gpu_power')
    echo "$prefix.gpu_power $gpu_power " | nc carbon.hostedgraphite.com 2003
    gpu_ram_power=$(echo "$line" | jq -r '.gpu_ram_power')
    echo "$prefix.gpu_ram_power $gpu_ram_power " | nc carbon.hostedgraphite.com 2003
    ram_power=$(echo "$line" | jq -r '.ram_power')
    echo "$prefix.ram_power $ram_power" | nc carbon.hostedgraphite.com 2003
    sys_power=$(echo "$line" | jq -r '.sys_power')
    echo "$prefix.sys_power $sys_power" | nc carbon.hostedgraphite.com 2003

    # CPU / ECPU / GPU usage arrays: [frequency, utilization]
    ecpu_freq=$(echo "$line" | jq -r '.ecpu_usage[0]')
    echo "$prefix.ecpu_frequency_hz $ecpu_freq" | nc carbon.hostedgraphite.com 2003
    ecpu_util=$(echo "$line" | jq -r '.ecpu_usage[1]')
    echo "$prefix.ecpu_utilization $ecpu_util" | nc carbon.hostedgraphite.com 2003
    pcpu_freq=$(echo "$line" | jq -r '.pcpu_usage[0]')
    echo "$prefix.pcpu_frequency_hz $pcpu_freq" | nc carbon.hostedgraphite.com 2003
    pcpu_util=$(echo "$line" | jq -r '.pcpu_usage[1]')
    echo "$prefix.pcpu_utilization $pcpu_util" | nc carbon.hostedgraphite.com 2003
    gpu_freq=$(echo "$line" | jq -r '.gpu_usage[0]')
    echo "$prefix.gpu_frequency_mhz $gpu_freq" | nc carbon.hostedgraphite.com 2003
    gpu_util=$(echo "$line" | jq -r '.gpu_usage[1]')
    echo "$prefix.gpu_utilization $gpu_util" | nc carbon.hostedgraphite.com 2003

    # Memory
    ram_total=$(echo "$line" | jq -r '.memory.ram_total')
    echo "$prefix.memory_ram_total_bytes $ram_total" | nc carbon.hostedgraphite.com 2003
    ram_usage=$(echo "$line" | jq -r '.memory.ram_usage')
    echo "$prefix.memory_ram_usage_bytes $ram_usage" | nc carbon.hostedgraphite.com 2003
    swap_total=$(echo "$line" | jq -r '.memory.swap_total')
    echo "$prefix.memory_swap_total_bytes $swap_total" | nc carbon.hostedgraphite.com 2003
    swap_usage=$(echo "$line" | jq -r '.memory.swap_usage')
    echo "$prefix.memory_swap_usage_bytes $swap_usage" | nc carbon.hostedgraphite.com 2003

    # Temperatures
    cpu_temp=$(echo "$line" | jq -r '.temp.cpu_temp_avg')
    echo "$prefix.temperature_cpu_celsius $cpu_temp" | nc carbon.hostedgraphite.com 2003
    gpu_temp=$(echo "$line" | jq -r '.temp.gpu_temp_avg')
    echo "$prefix.temperature_gpu_celsius $gpu_temp" | nc carbon.hostedgraphite.com 2003

    break
  done

  sleep 300
done
Now just save the file, make it executable, and run it in the background (without logs):
chmod +x <path-to-file>/macmon-metrics.sh
nohup <path-to-file>/macmon-metrics.sh >/dev/null 2>&1 &
Step 3: Interpreting macOS GPU Metrics
The above script will collect and forward 19 system performance metrics, including some GPU stats - here's what they represent:
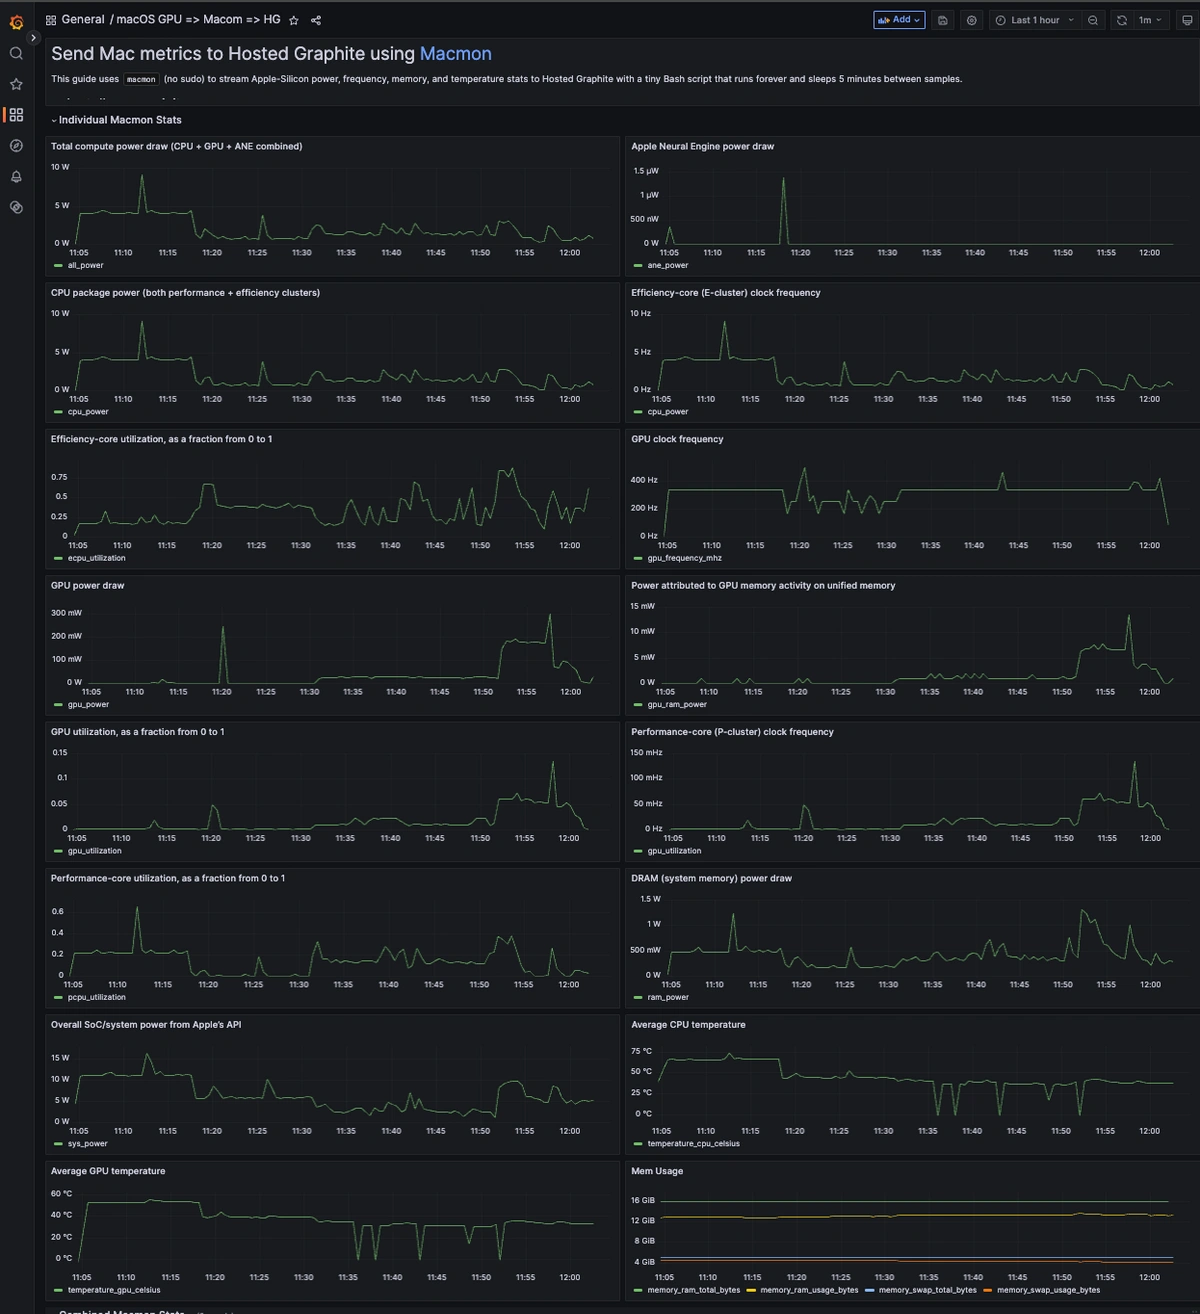
- gpu_utilization is the “how busy” number, reported as a fraction from 0 to 1. A render might peg this near 1.0; a mostly-CPU workflow will sit lower.
- gpu_frequency_mhz is the clock. When things get hot, you’ll often see frequency sag even while utilization stays high, which indicates throttling. Pair frequency with temperature for the full picture.
- gpu_power (in watts) tells you how hard the GPU is being driven. Battery users care about this because 12–20 W sustained is a very different battery story than 3–5 W.
- temperature_gpu_celsius closes the loop. If temps are high and frequency drops while utilization stays elevated, you’re thermally limited. That’s your cue to tweak: reduce preview resolution, cap FPS, cool the chassis, adjust workload chunking, or just plan around sustained loads.
Visualizing macmon GPU Metrics in Grafana (new)
Once Macmon data is flowing into Hosted Graphite, visualize trends with Grafana dashboards. Ideal for spotting throttling, battery drain, or thermal issues. Here's what these macmon metrics look like when visualized in your Hosted Grafana dashboards:
FAQs:
Q1. What is macmon GPU?
macmon GPU is a lightweight macOS utility that streams Apple Silicon GPU performance metrics such as power, utilization, and temperature in real time.
Q2. How do I monitor my Mac’s GPU performance?
Install macmon via Homebrew and forward metrics to Hosted Graphite using a simple Bash script. You can then visualize performance trends in Grafana.
Q3. What GPU metrics does macmon track?
macmon reports GPU power usage, frequency, temperature, and utilization—ideal for detecting throttling or background GPU activity.
Q4. Why use Hosted Graphite with macmon?
Hosted Graphite lets you store, query, and visualize GPU data in customizable dashboards, making it easy to diagnose performance bottlenecks.
Q5. Does macmon require root or kernel extensions?
No, macmon runs without sudo, kexts, or elevated privileges, ensuring safe and fast access to Apple Silicon GPU stats.
Conclusion
This isn’t about graphs for the sake of graphs; it’s about closing the feedback loop in your day-to-day workflow. For example, if you’re cutting video, a timeline that “feels sticky” might show 95% GPU utilization with clocks sliding down after a minute, indicating classic thermal throttling. So now you can take action by lowering the preview quality, rendering shorter export chunks, or simply giving the machine more airflow until you see the numbers stabilize. You don’t need heavyweight tooling to get this kind of visibility. macmon, combined with a tiny bash script, provides you with the GPU’s vital signs in an easy-to-understand time-series format. Once you’ve got the signals, tuning your workflow becomes less of a guess and more repeatable.
Macmon GPU monitoring turns system performance into actionable insight. Reach out to MetricFire today to visualize and fine-tune your Apple Silicon workloads with full visibility into any environment!
Book a demo with MetricFire experts or sign up for the free trial today to learn more about our features.


