
Table of Contents
Great systems are not just built. They are monitored.
MetricFire is the fully managed Graphite and Grafana platform for small teams that don’t want to self-host their monitoring stack. Pre-built dashboards, alerts, and native add-ons for Heroku, AWS, Azure, and GCP. All with dedicated support and no infrastructure to maintain.
Introduction
MongoDB’s strength in flexible schema and fast iteration can also mask costly queries until they arise as user-facing latency, replica lag, or spiky CPU usage.
A handful of slow operations can impact the cache, starve other workloads, and cascade into timeouts across services. Monitoring slow queries provides an early warning system for index gaps and query-plan regressions introduced by code deployments, schema changes, or changes in data shapes. By capturing some essential details and correlating them with system metrics, you can move from “it feels slow” to concrete fixes within minutes. In short, slow-query visibility is the fastest path to stable latencies, healthier replicas, and lower hardware burn.
In this guide, you’ll enable slow-query logging, make the logs readable for MetricFire's Hosted Loki integration, and collect core MongoDB metrics with Telegraf. It’s minimal, reproducible, and production-friendly.
Start a chat with us today to test MetricFire's Logging Integration for FREE. We will help you every step of the way, from collection to visualization!
Step 1: Enable MongoDB Slow Ops
Confirm the Log Path
This article assumes that you are already running an instance of MongoDB. This prints the systemLog block from mongod.conf so you know exactly where MongoDB writes its server log (usually /var/log/mongodb/mongod.log on Ubuntu). Verify the destination is file and note the path, which is what Promtail will tail later on.
sudo grep -A3 -nE '^systemLog:' /etc/mongod.conf
Enable Slow Query Ops
We'll use a clean database named slowtest and enable profiling so any operation > 1000 ms is captured. sampleRate avoids sampling so every slow op is recorded during your tests.
mongosh slowtest --eval 'db.setProfilingLevel(1, { slowms: 1000, sampleRate: 1.0 })'
mongosh slowtest --eval 'db.docs.updateOne({_id:1}, {$set:{x:1}}, {upsert:true})'
mongosh slowtest --eval 'db.getProfilingStatus()'
Example Slow Operation
This $where busy-wait forces ~1.2 s of server time, guaranteeing it’s captured as a slow op. NOTE: use $where only for controlled testing and don’t ship this pattern in application code, as it executes JavaScript and deliberately burns CPU.
mongosh slowtest --eval 'db.docs.find({$where:"var t=Date.now()+1200;while(Date.now()<t){};1"}).toArray()'
Step 2: Install and Configure Promtail to Collect System Logs
We support log collection via OpenTelemetry Contrib, Alloy, and Promtail. In this example, we'll detail how to configure Promtail since it is an official log shipping agent for Grafana Loki. It runs as a lightweight binary that tails log files (like /var/log/*) and forwards them to our Hosted Loki endpoint over HTTP.
Install/unpack Promtail (Ubuntu)
wget https://github.com/grafana/loki/releases/download/v3.5.3/promtail_3.5.3_amd64.deb

sudo apt-get install -y ./promtail_3.5.3_amd64.deb
Configure Promtail to Forward Logs
Update your Promtail configuration file at /etc/promtail/config.yml to include the following:
server:
  http_listen_port: 9080
  grpc_listen_port: 0

positions:
  filename: /tmp/positions.yaml

clients:
  - url: https://<YOUR-API-KEY>@www.hostedgraphite.com/logs/sink

scrape_configs:
  - job_name: mongodb-logs
    static_configs:
      - targets:
          - localhost
        labels:
          host: <HOST-NAME>
          job: mongodb-logs
          __path__: /var/log/mongodb/mongod.log
NOTE: Make sure to replace YOUR-API-KEY and HOST-NAME in the above config and restart the Promtail service:
sudo systemctl restart promtail
sudo systemctl status promtail
Step 3: Create a Loki Data Source in our Hosted Grafana
REACH OUT TO US about trying our new Logging feature for FREE, and we will create a Loki Access Key in your Hosted Graphite account. If you don't already have a Hosted Graphite account, sign up for a free trial here to obtain a Hosted Graphite API key and Loki Access Key.
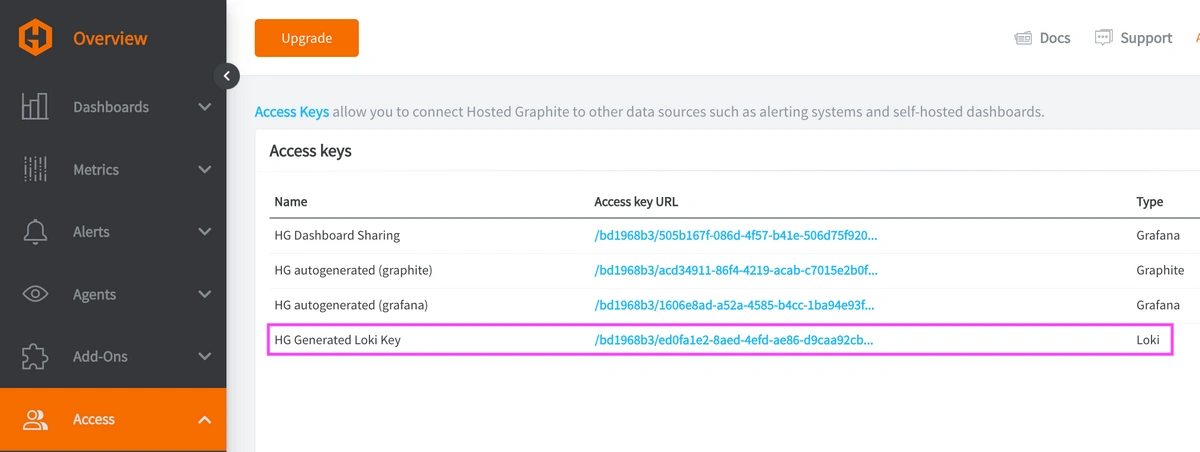
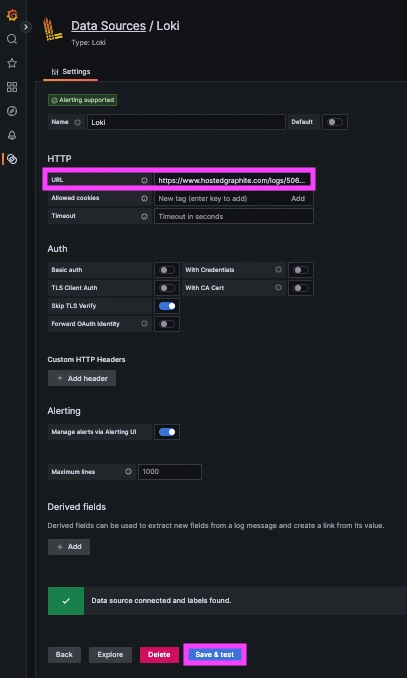
Now within the Hosted Graphite UI, you can navigate to Dashboards => Settings => Data sources => Add New Data source (Loki). You'll be able to add the URL for your HG Loki endpoint, which includes your new Loki Access Key: https://www.hostedgraphite.com/logs/<UID>/<LOKI-ACCESS-KEY>
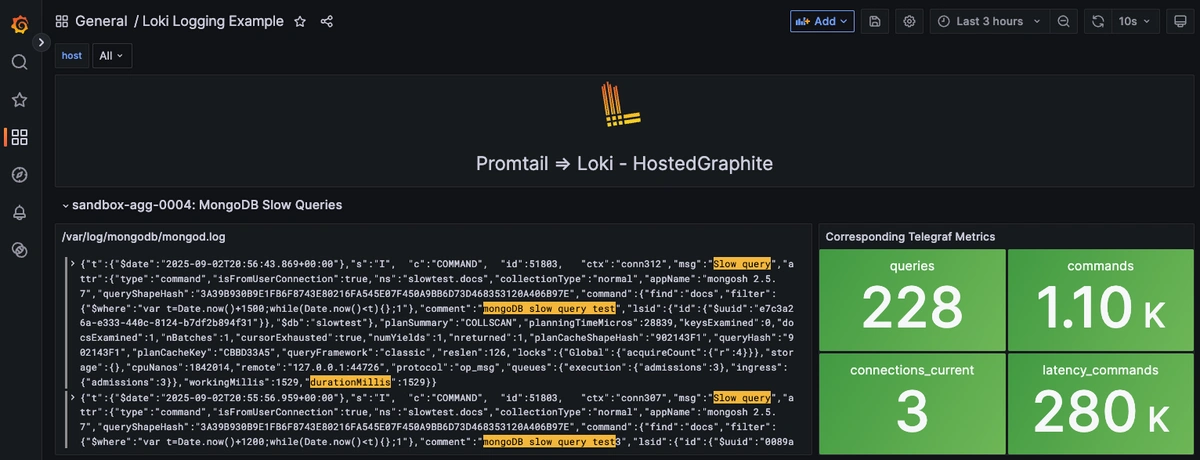
Step 4: Visualize the Slow Ops Logs
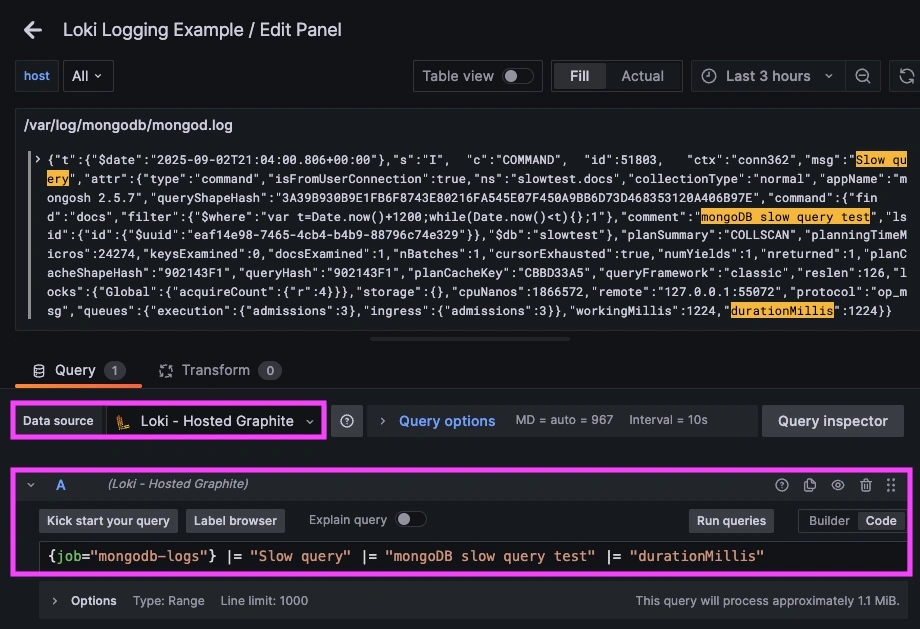
Once logs are forwarded to our Loki endpoint and the data source is connected in your Hosted Grafana, you can create a new dashboard panel, select Loki as your Data source, and format a query using 'code mode'.
Example Loki query: {job="mongodb-logs"} |= "Slow query" |= "durationMillis"
Now you can send more example ops that take > 1000ms seconds to complete, and see them appear right on your dashboard!
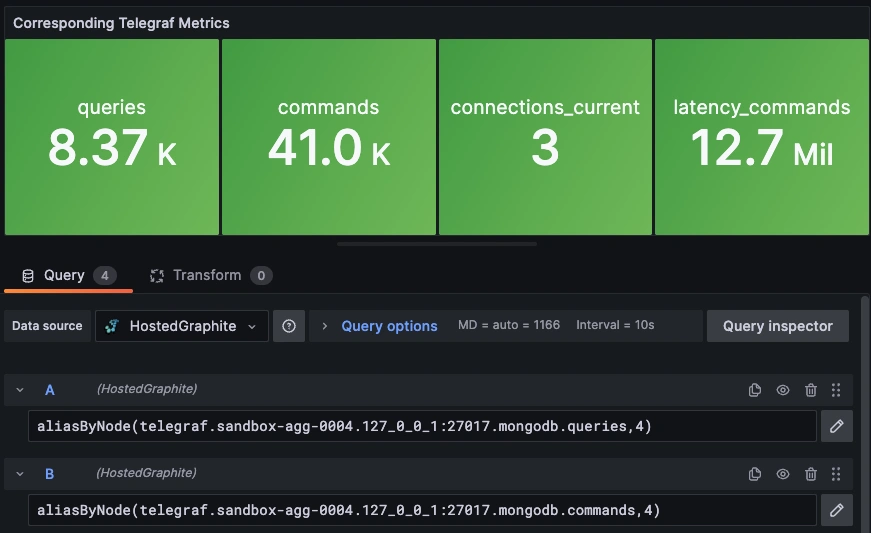
Step 5: Configure Telegraf to Send Corresponding MongoDB Metrics
Use Telegraf's MongoDB input plugin to scrape lightweight stats directly from serverStatus/dbStats so you can graph trends alongside your slow logs.
Setup the Telegraf Collector
If you don't already have an instance of Telegraf running in your server, install our handy HG-CLI tool to quickly install/configure Telegraf:
curl -s "https://www.hostedgraphite.com/scripts/hg-cli/installer/" | sudo sh
NOTE: You will need to input your Hosted Graphite API key, and follow the prompts to select which metric sets you want.
Once Telegraf is installed, open its configuration file at: /etc/telegraf/telegraf.conf to add the following section:
[[inputs.mongodb]]
  servers = ["mongodb://127.0.0.1:27017/?connect=direct"]
Ship Performance Metrics to Hosted Graphite
Simply save your updated conf file, and restart the Telegraf service to forward MongoDB performance metrics to your HG account. Or run it manually to inspect the output for potential syntax/permission errors:
telegraf --config /etc/telegraf/telegraf.conf
Once these metrics hit your Hosted Graphite account, you can use them to easily create custom dashboards and alerts!
Conclusion
Treat slow-query monitoring as a lightweight, continuous feedback loop by establishing a sensible threshold, and make the signal easy to read in your dashboards. Pair the slow-op log with key metrics to identify cause and effect, and use the findings to drive your next steps. Try to keep overhead low by profiling only the databases that matter and increasing the threshold once you’ve tuned the hot paths. With this workflow in place, MongoDB remains fast as your data and traffic grow, and performance issues become quick, deliberate fixes instead of persistent problems.
Ship logs alongside metrics and you’ll fix performance regressions with speed and confidence. Instead of jumping between tools or manually inspecting your server logs, you can correlate a spike in metrics with the exact log line that makes sense, all in a single dashboard.
MetricFire's Hosted Loki logging integration is quick to set up but powerful in practice. Whether you're tracking security threats, service restarts, failed jobs, or kernel anomalies, it gives you the visibility you need to stay ahead of problems and reduce the time it takes to resolve them. Combined with monitoring your instance of MongoDB, it's a surefire way to maintain optimal database performance, ensure security, detect and address issues promptly, and plan for future growth and scalability.
Reach out to the MetricFire team today and let’s build something great together!


