 +
+

To integrate Amazon ElastiCache with MetricFire, please sign up for a free 14 day trial. We want to fully understand your requirements and monitoring goals, so we can advise you on how to obtain better visibility into your infrastructure. Please book a demo with us so we can show you how quick and easy it is to get meaningful data into your MetricFire account, and use that data to build custom dashboards and alerts.
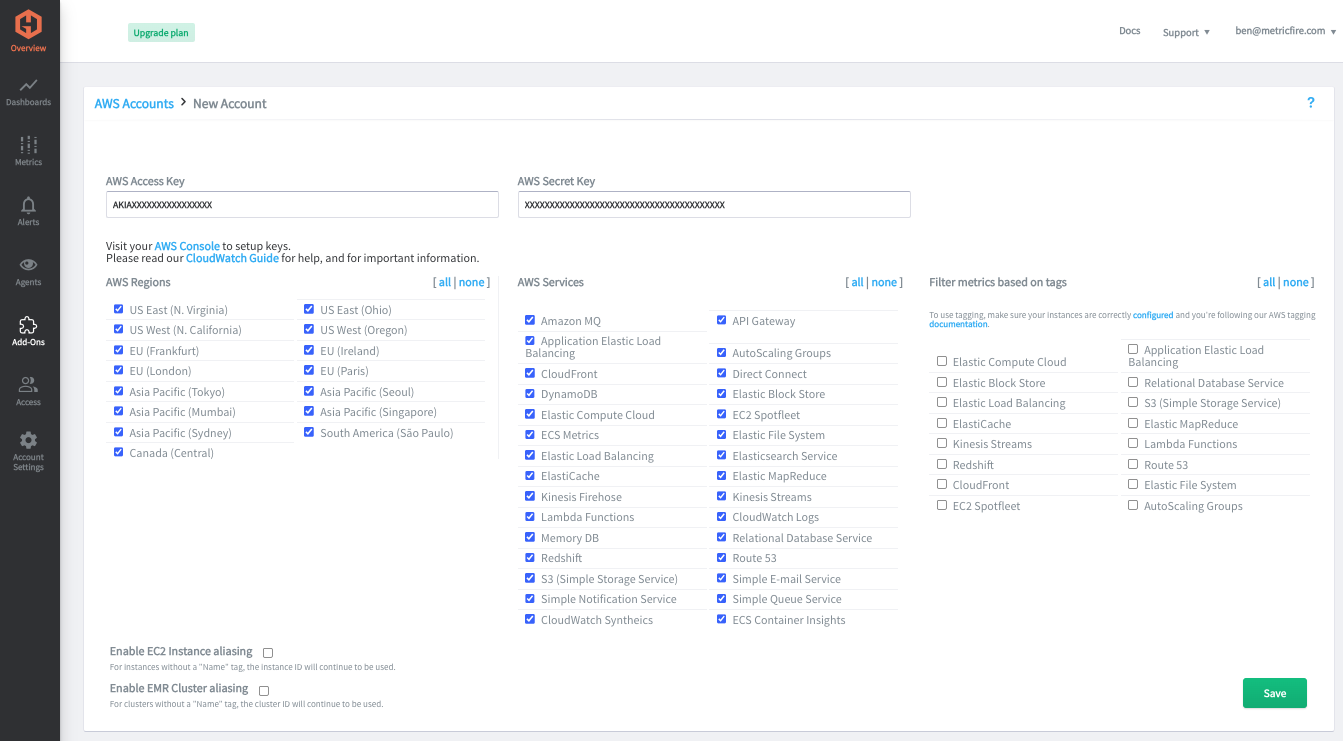
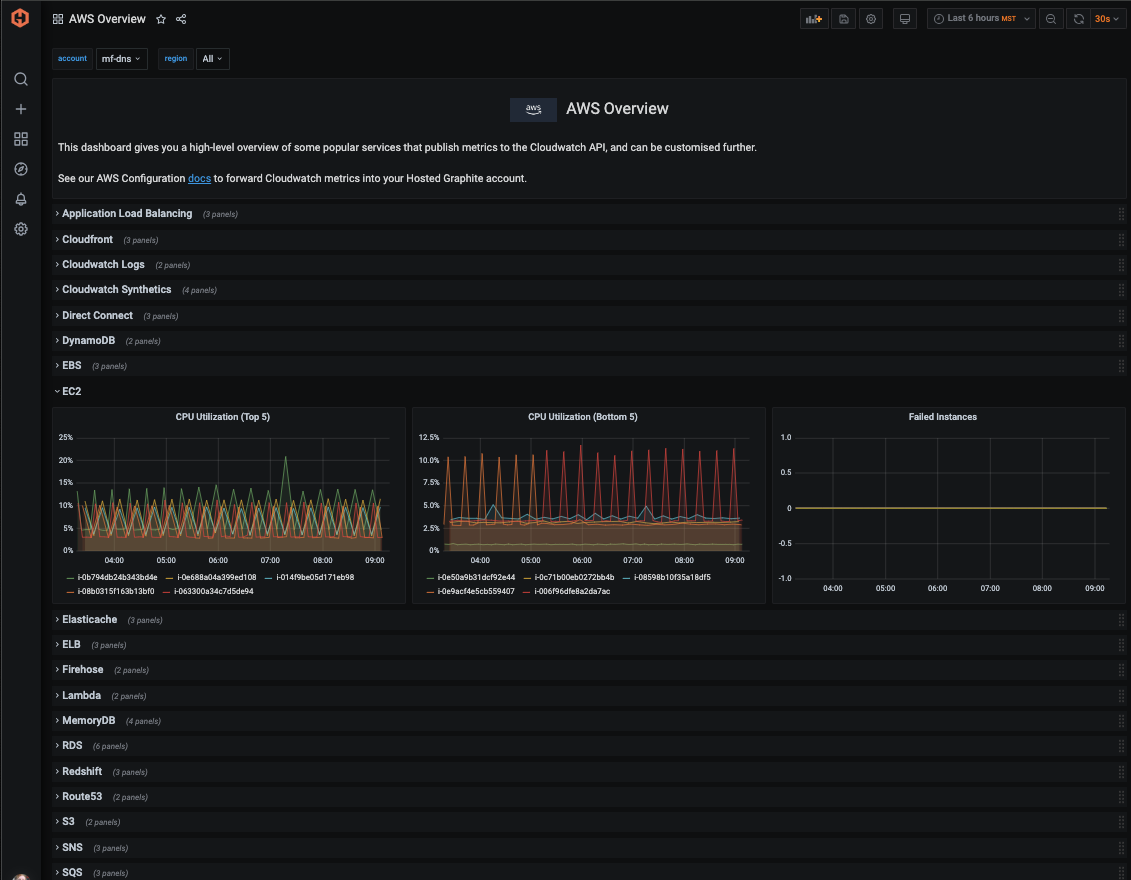
MetricFire has an easy to use integration that pulls metrics from the Cloudwatch API, and forwards them to a Hosted Graphite account. You can configure this integration in a few simple steps:
If you have any issues with configuring this integration, or need to integrate with a service that is not currently listed, please contact our team. We will be happy to help you out, and develop new AWS integrations for you!
MetricFire is a full-scale platform that provides infrastructure, system, and application monitoring using a suite of open-source tools. We will aggregate and store your data as time series metrics, which can be used to build custom dashboards and alerts. MetricFire takes away the burden of self-hosting your own monitoring solution, allowing you more time and freedom to work on your most important tasks.
MetricFire offers a complete ecosystem of end-to-end infrastructure monitoring, comprised of open-source Graphite and Grafana. MetricFire handles the aggregation, storage, and backups of your data, and offers alerting, team features, and API's for easy management of your monitoring environment. You can send server metrics using one of our agents, custom metrics from within your application code, and integration metrics from a variety of popular 3rd party services that we integrate with like Heroku, AWS, Azure, GCP, and many more!
Our Hosted Graphite product has improved upon standard Graphite to add data dimensionality, optimized storage, and offers additional tools and features that provide customers with a robust and well-rounded monitoring solution.
“We now have over ten times the amount of metrics we started with, and on different accounts. One of the great things about MetricFire is that scaling to support this increase has been hassle-free, requiring no additional work on our side.”
“Building and managing an on-premise installation at this scale would require a lot of engineer time, especially in the first year...we use this engineering time to work on initiatives closer to our core business”
“There’s complete transparency with everything MetricFire do which means we can accurately predict what we’ll be spending and comfortably keep within our budget.”
"Every time I have a question, I get an answer from support after just a couple of hours. Their technical knowledge is excellent.”
Adding Hosted Graphite gives you a real-time, interactive view of your Firehose performance metrics... Continue Reading
DogStatsDは便利な一方でベンダーロックインの原因にもなります。本記事ではTelegrafを使い、既存のDogStatsD計測を維持したままDatadog依存を減らし、他の監視バックエンドへ移行する方法を解説します。 Continue Reading
本記事では、DCGM Exporterのインストール方法、/metricsのスクラップ方法、Grafanaでの可視化方法、そして電力、エラー、使用率に関するアラートの設定方法を解説しています。 Continue Reading