 +
+

To integrate Hosted StatsD with MetricFire, please sign up for a free 14 day trial. We want to fully understand your requirements and monitoring goals, so we can advise you on how to obtain better visibility into your infrastructure. Please book a demo with us so we can show you how quick and easy it is to get meaningful data into your MetricFire account, and use that data to build custom dashboards and alerts.
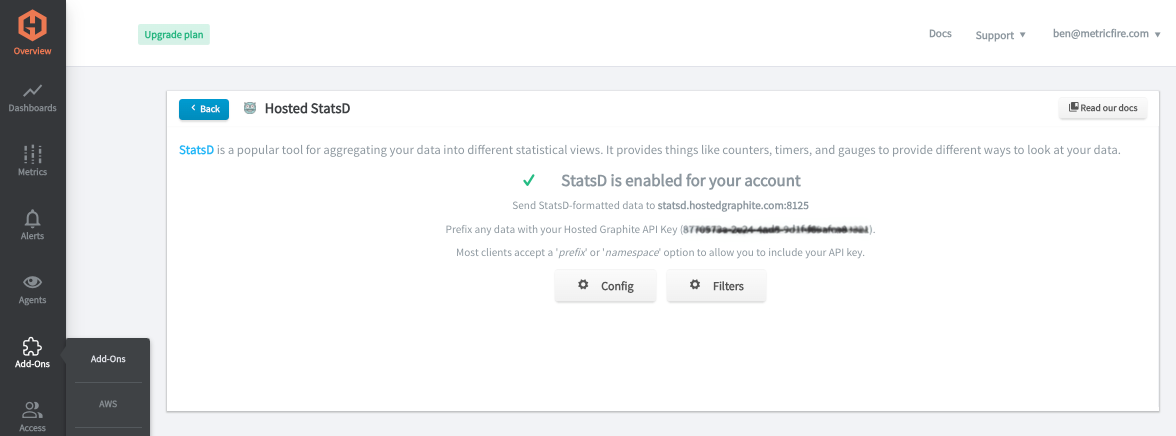
StatsD is commonly used in DevOps and software engineering environments to gain insights into the performance and behavior of applications. To use our convenient Hosted StatsD servers, all you need to do is navigate to Add-Ons => Hosted StatsD and click 'Enable' in your Hosted Graphite account.
There are some additional configuration options for filtering and auto-deleting certain timer views, and you can learn more about these options in the Hosted Graphite documentation here. Once this is enabled, you can send your StatsD metrics directly to our Hosted StatsD endpoint: statsd.hostedgraphite.com 8125
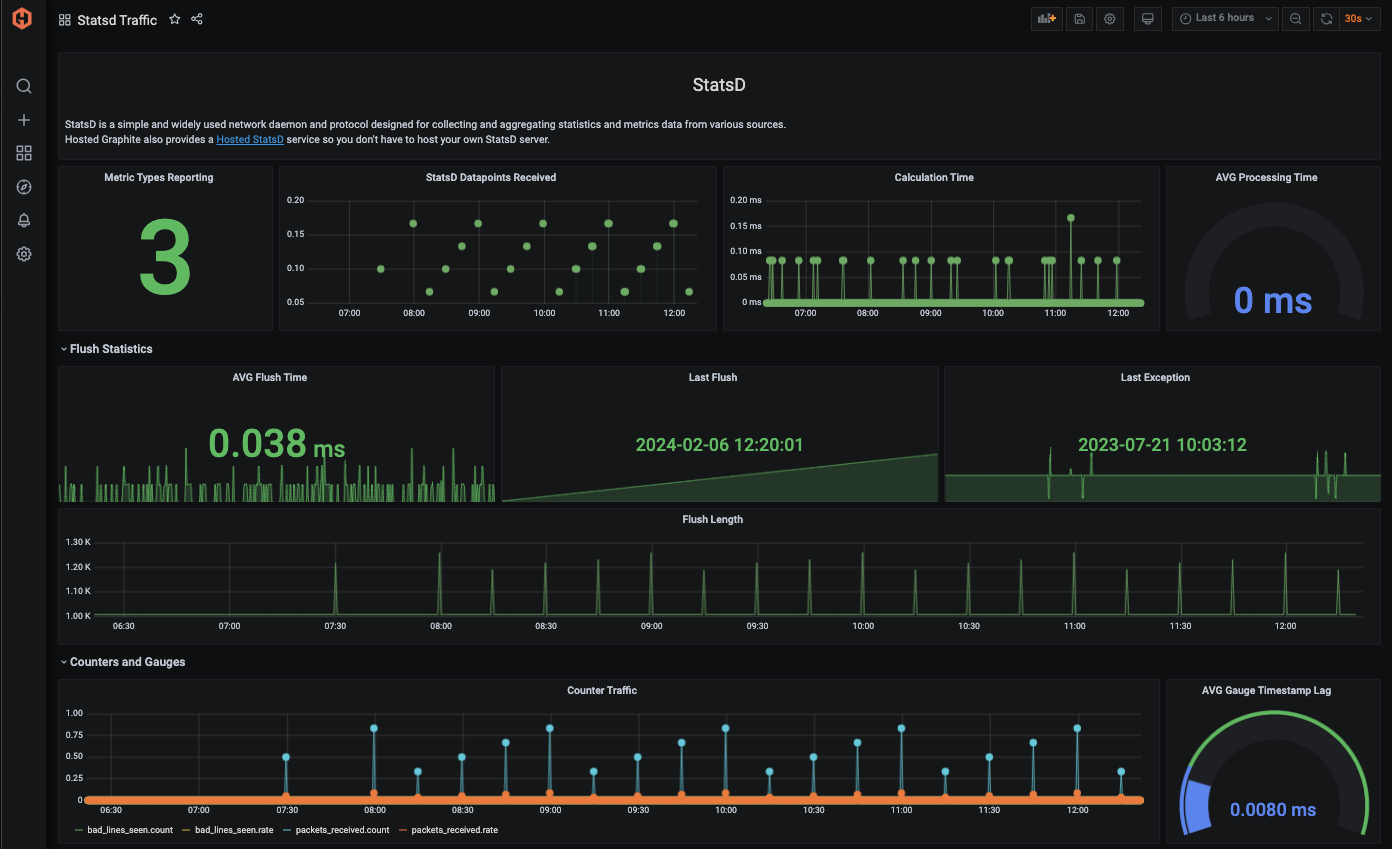
Additionally, some internal StatsD traffic metrics will be created in your account, and can be visualized in a StatsD Traffic dashboard that can be generated from our Dashboard Library:
MetricFire is a full-scale platform that provides infrastructure, system, and application monitoring using a suite of open-source tools. We will aggregate and store your data as time series metrics, which can be used to build custom dashboards and alerts. MetricFire takes away the burden of self-hosting your own monitoring solution, allowing you more time and freedom to work on your most important tasks.
MetricFire offers a complete ecosystem of end-to-end infrastructure monitoring, comprised of open-source Graphite and Grafana. MetricFire handles the aggregation, storage, and backups of your data, and offers alerting, team features, and API's for easy management of your monitoring environment. You can send server metrics using one of our agents, custom metrics from within your application code, and integration metrics from a variety of popular 3rd party services that we integrate with like Heroku, AWS, Azure, GCP, and many more!
Our Hosted Graphite product has improved upon standard Graphite to add data dimensionality, optimized storage, and offers additional tools and features that provide customers with a robust and well-rounded monitoring solution.
“We now have over ten times the amount of metrics we started with, and on different accounts. One of the great things about MetricFire is that scaling to support this increase has been hassle-free, requiring no additional work on our side.”
“Building and managing an on-premise installation at this scale would require a lot of engineer time, especially in the first year...we use this engineering time to work on initiatives closer to our core business”
“There’s complete transparency with everything MetricFire do which means we can accurately predict what we’ll be spending and comfortably keep within our budget.”
"Every time I have a question, I get an answer from support after just a couple of hours. Their technical knowledge is excellent.”
本記事では、HG-CLIの概要と、ターミナルユーザーインターフェース(TUI)モードおよびコマンドラインインターフェース(CLI)モードでの使用方法を解説します。さらに、収集されたメトリクスをHosted Graphiteアカウントに転送した後の活用方法もご紹介します。 Continue Reading
MetricFireのHosted Grafanaでログとメトリクスを統合することで、トラブルシューティングの高速化、パターンの容易な発見、性能問題やシステムイベントに関する重要な状況把握が可能になります。本記事では、この新たな統合機能の設定方法と使用方法を解説します。 Continue Reading