
Table of Contents
- Custom Dashboard Creation: Step-by-Step Tutorial
- Creating Grafana Dashboards | Grafana Setup & Simple Dashboard (Chart, Gauge, Table)
- Prerequisites and Initial Setup
- Step 1: Creating a New Dashboard
- Step 2: Adding and Configuring Panels
- Step 3: Customizing Visualizations and Layout
- Step 4: Adding Variables for Dynamic Dashboards
- Step 5: Saving, Sharing, and Setting Alerts
- Best Practices for MetricFire Dashboards
- Conclusion
- FAQs
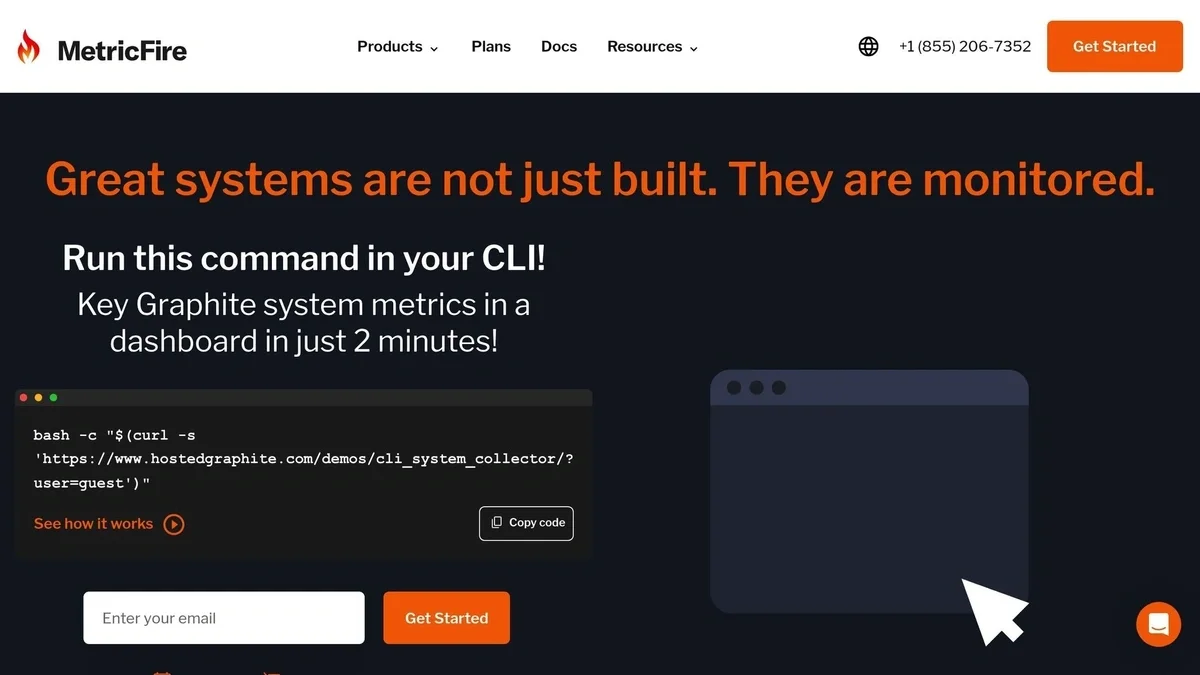
Great systems are not just built. They are monitored.
MetricFire runs Graphite and Grafana as a fully managed service for growing engineering teams, taking care of storage, scaling, and version updates so your team doesn't have to. Plans start at $19/month, billed per metric namespace rather than per host, and include engineer-staffed support. Integrations work natively with Heroku, AWS, Azure, and GCP, and data is stored with 3× redundancy in SOC2- and ISO:27001-certified data centres.
Custom Dashboard Creation: Step-by-Step Tutorial
Creating a custom dashboard is the best way to monitor metrics that matter most to your systems. Tools like MetricFire make this process straightforward by combining hosted Grafana and Graphite, eliminating the need for self-hosted solutions. Here's how you can build dashboards tailored to your needs:
- Why Custom Dashboards? They focus on relevant metrics, helping teams track performance and detect issues early. For instance, dashboards for Kubernetes differ from those for API monitoring.
- MetricFire Plans: Start with the Pro Plan at $19/month or scale up to Advanced/Enterprise tiers for larger needs. All plans include transparent pricing with no hidden fees.
- Setup Process: Sign up for MetricFire, access hosted Grafana, and connect data sources like AWS, Kubernetes, or Prometheus.
- Dashboard Building: Use Grafana's interface to add rows, panels, and visualizations (e.g., time-series graphs, tables). Configure queries to fetch precise data.
- Advanced Features: Add variables for dynamic dashboards, set alerts for key metrics, and save/export dashboards for sharing or backups.
MetricFire simplifies scaling, reduces maintenance costs by up to 75%, and helps teams improve monitoring efficiency. Start small, focus on critical metrics, and expand as needed.
Creating Grafana Dashboards | Grafana Setup & Simple Dashboard (Chart, Gauge, Table)
Prerequisites and Initial Setup
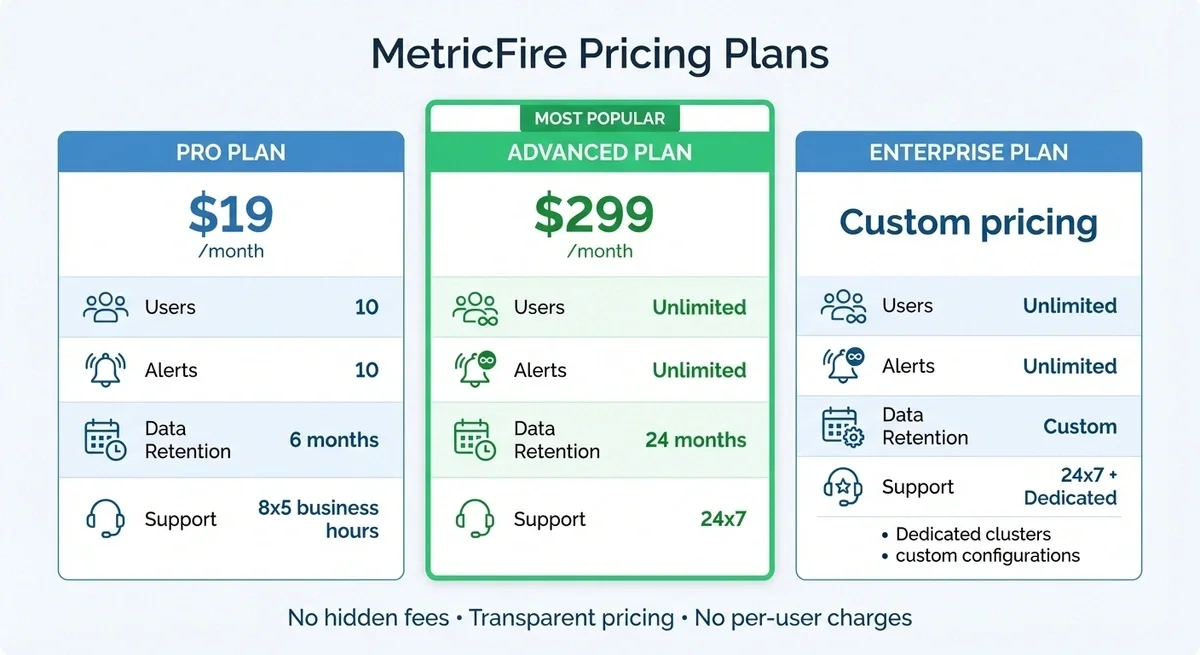
MetricFire Pricing Plans Comparison: Pro vs Advanced vs Enterprise
To get started, you'll need a MetricFire account and access to the hosted Grafana platform. Knowing what's required in advance will make the setup process much smoother. This guide walks you through everything - from creating an account to linking your data sources.
Account Requirements
MetricFire offers three subscription tiers: Pro, Advanced, and Enterprise. Here's a quick breakdown:
- Pro Plan: Starts at $19/month. Includes 10,000 metrics, 10 users, 10 alerts, and 6 months of data retention. Support is available during 8x5 business hours.
- Advanced Plan: Costs $299/month. Offers 20,000 metrics, unlimited users and alerts, 24 months of data retention, and 24x7 support.
- Enterprise Plan: Designed for large-scale needs with dedicated clusters and custom configurations. Pricing is available on request.
Choose a plan based on your monitoring needs. For example, if you're tracking metrics across Kubernetes clusters or cloud services like AWS, Azure, or GCP, the Advanced or Enterprise plans are better suited due to their higher metric limits and extended retention periods.
Accessing Grafana and Configuring Data Sources
Once your account is set up, log in to MetricFire to access your Hosted Grafana instance. The platform eliminates the need for installation or server maintenance, giving you immediate access to Grafana's robust monitoring tools.
The next step is connecting your data sources. MetricFire supports numerous integrations, including AWS CloudWatch, Azure Monitor, Google Stackdriver, Prometheus, Graphite, InfluxDB, and Kubernetes. To send metrics from your servers, containers, or cloud environments, you'll need to install collectors such as Telegraf, StatsD, or collectd. For organizations needing to expose data from databases and backend systems as governed APIs, DreamFactory provides a self-hosted platform for secure API access to any data source, which can complement your monitoring infrastructure.
In Grafana, head to the data source configuration section. Add your data sources by selecting the appropriate data source type and providing the required API keys, endpoints, or credentials. In Kubernetes, you typically deploy a collector as a DaemonSet to automatically collect cluster metrics. Once configured, test each connection to confirm that data is flowing correctly into your dashboards.
Step 1: Creating a New Dashboard
Navigating the Grafana Interface
Once you're logged into your MetricFire account, you'll find yourself in the hosted Grafana interface. In the left sidebar, you'll see the navigation menu, which includes options such as dashboards, explore, alerting, and configuration settings. To begin creating a new dashboard, click the plus icon (+) on the sidebar and choose "Dashboard" from the dropdown. This will open a blank canvas where you can start building your custom monitoring views.
At the top of the interface, you'll notice key controls such as the time range picker, refresh interval selector, and the Save dashboard button on the right. Make sure you have Editor or Admin permissions before starting, as Viewer roles cannot save changes. If you're getting started with Grafana, take a moment to get comfortable with the layout. Once you're ready, you can start organizing your dashboard by adding rows.
Setting Up Rows and Saving the Dashboard
Rows are a great way to group panels, keeping your dashboard structured and easy to navigate. To add a row, click "Add panel" and then select "Add a new row" from the available options. You can set rows to collapse by default, which helps keep the dashboard tidy and allows users to expand sections only when needed.
If you're monitoring multiple servers, you can use repeating rows in the Row Options to automatically group each variable value. Once your layout is ready, click the Save dashboard icon, give your dashboard a clear and descriptive title (e.g., "Production Monitoring 02/04/2026"), and choose a folder for organization.
One of the best parts? MetricFire ensures your dashboards are always secure and up to date with automatic backups.
"Your dashboards are always available, automatically backed up, and kept up to date." - MetricFire
To avoid losing any progress, save your work frequently.
Step 2: Adding and Configuring Panels
Choosing Panel Types
Once your dashboard structure is ready, it's time to bring it to life by adding panels to display your metrics. Start by clicking + Add visualization and selecting the panel type that fits your needs. For tracking metrics that fluctuate over time - like CPU usage, memory changes, or network throughput - time-series graphs are a solid choice. If you want to highlight a single value against a threshold, such as current disk space usage, gauges work perfectly. When you need to list details like Kubernetes pod statuses or event counts, tables provide a clean, organized format.
For comparing metrics across categories, like memory usage across multiple Docker containers, bar charts and histograms are particularly useful. The type of visualization you choose should align with how you want to present your data. As Grafana's documentation explains:
"Selecting the best visualization depends on the data and how you want it presented." - Grafana Documentation
Once you've selected the right panel type, the next step is to configure the metrics and queries that will power it.
Configuring Metrics and Queries
Every panel requires at least one query to fetch data from your selected data source. When monitoring Kubernetes with Grafana, focus on key metrics like CPU, memory, network throughput, and request latencies to spot potential bottlenecks. In the panel editor, you can refine your data using Graphite functions. For instance, use summarize() to group data points over intervals (e.g., 5 minutes or 1 hour), or apply aggregate() or sumSeries() to combine metrics from multiple sources.
When dealing with multiple series that operate on different intervals, the consolidateBy() function can help. It lets you specify how Graphite should reduce data points - whether by sum, avg, or max - to maintain consistency when the maxDataPoints limit is applied. For example, if you're tracking memory usage across all relay instances, you could query carbon-relay-ng.stats.*.memory.bytes.*.gauge64 and use aggregate(..., 'max') to identify peak memory usage. Additionally, use the Standard options to format numbers with commas (e.g., 1,234.56) and display values in appropriate units.
With your panels set up, the next step is to fine-tune their layout for a more effective visual presentation.
Step 3: Customizing Visualizations and Layout
Improving Panel Readability
To make your panels easier to understand, use specific and descriptive titles. For instance, instead of a vague label like "CPU Usage," use a label that directly addresses the chart's purpose, such as "Servers Over 80% CPU".
You can also enhance clarity with visual thresholds. For example, set colors to change automatically when certain values are reached - like turning red if disk usage exceeds 90%. For bar charts, sorting by measure can emphasize the highest or lowest values, while sorting alphabetically helps users find categories faster. Adding short descriptions to panels is another helpful touch. These descriptions, accessible via a hoverable "i" icon, provide additional context without cluttering the interface. Finally, ensure that legends are arranged to match the natural order of the data.
"Simplicity leads to understanding and keeps your audience on board" - Piers Batchelor, Product Manager at Astrato
Once your panels are clear, focus on arranging the dashboard layout for better usability.
Arranging Panels and Themes
To create a logical flow, organize panels in a way that reflects the structure of your data, such as when building IoT dashboards with Grafana. MetricFire suggests grouping related panels into rows to tell a cohesive story. For example, in infrastructure monitoring, dedicate separate rows to CPU metrics, memory usage, and network throughput. Place the most critical KPIs in prominent positions, and avoid overcrowding to keep the dashboard easy to navigate.
When it comes to layout options, you can choose between Custom Layout for precise control or Auto Grid Layout for dashboards that automatically adjust to different screen sizes. Auto Grid Layout is especially handy if your team uses various devices, as it ensures consistent panel resizing. Adjust the "Min column width" (Narrow, Standard, or Wide) and row heights to ensure readability, even on smaller screens. Keep enough whitespace around elements to reduce visual clutter and make the dashboard easier to process. Additionally, use show/hide rules to automatically hide panels with no data, keeping the focus on active issues and eliminating unnecessary distractions.
sbb-itb-bb06c8f
Step 4: Adding Variables for Dynamic Dashboards
Defining and Using Dashboard Variables
Variables transform a static dashboard into a tool you can adjust on the fly. They allow you to filter and search for the data you care about most without having to constantly tweak queries or rebuild dashboards.
"Variables make your Grafana dashboards dynamic instead of static. They allow you to filter and search for the data you care about most, without having to edit queries or rebuild dashboards." - Ronald McCollam, Author, Grafana Labs
Once your panels are set up, adding dynamic variables elevates your dashboard's flexibility. Variables let you customize views in real time, making monitoring more efficient.
To set up a variable, click the gear icon, go to Dashboard Settings, select Variables, and then click Add variable. Assign a name (e.g., cluster or namespace) and use a Label to clarify its purpose. For example, if your variable is named server_id_01, a label like "Select Server" makes it clear to users what they're selecting.
Query variables can automatically pull values from your data source. For instance, you could fetch a list of all cluster names from Prometheus, which would populate a dropdown menu without requiring manual updates. You can also create chained variables - where selecting a value in one dropdown (like $cluster) filters the options in another (like $namespace). To make the dashboard even more user-friendly, enable Multi-value and Include All options. This allows users to select multiple items or view all data at once.
For convenience, place frequently used variables at the top of the settings list. This ensures they appear on the far left of your dashboard for quick access. Use the Regex field to filter out irrelevant values, such as system namespaces you don't want to display. Set the refresh option to On dashboard load to keep the variable lists up to date. Always test your variable using the Preview section to ensure it behaves as expected. Once everything is configured, you can reference variables in queries using $varname or ${var_name} for embedding within expressions.
Step 5: Saving, Sharing, and Setting Alerts
Saving and Exporting Dashboards
To preserve your configurations, save your dashboard. You can do this by clicking the "Save dashboard" icon or pressing Ctrl+S. When saving, include a change summary to create a version history that helps your team track modifications over time, following dashboard best practices. If you want to experiment without affecting the original, use the "Save as copy" option from the save dropdown menu. Need a backup or want to migrate your dashboard? Use the "Export" option to save it as a JSON file. This file can be imported into other Grafana instances, making it easy to share or move your setup.
Grafana Cloud offers additional convenience by storing deleted dashboards in a deletion history for up to 12 months. Plus, you can organize your dashboard folders into nested structures, up to four levels deep, to manage even the most complex monitoring setups effectively.
Once your dashboard is saved and exported, you're ready to connect alerts for more proactive monitoring.
Integrating Alerts with MetricFire
MetricFire's alerting system lets you link alerts directly to your dashboard panels, ensuring critical thresholds are actively monitored. For instance, you can set alerts to notify your team when CPU usage exceeds a threshold or when response times spike. The system supports multiple notification channels, including PagerDuty, Slack, email, and webhooks, so the right people are alerted instantly when an issue requires attention.
When sharing dashboard links, consider enabling the "Lock time range" feature. This ensures recipients view the exact time window you're referencing rather than a shifting, relative range. For public snapshots, you can set expiration times - such as 1 hour, 1 day, or 1 week - to automatically remove the data when it's no longer needed. Additionally, permissions can be managed at the folder level, making access control and administration more straightforward.
Best Practices for MetricFire Dashboards
Designing for Clarity and Usability
A clear and well-organized dashboard is easier to use and interpret. To achieve this, avoid overcrowding your dashboards. Two key methods can help: the USE Method (Utilization, Saturation, Errors) for hardware and infrastructure monitoring, and the RED Method (Rate, Errors, Duration) for tracking services and user experience. These frameworks simplify complex data, making it easier to spot issues at a glance.
Consider using a master-detailed approach. Create a primary dashboard for high-level KPIs and separate, focused dashboards for in-depth troubleshooting. With Grafana's "Convert to row" feature, you can group related metrics and keep the layout organized and logical. This approach ensures your dashboards are not only visually appealing but also functional and efficient.
Once your dashboards are clear and user-friendly, the next step is to fine-tune their performance to maintain responsiveness.
Improving Performance
Efficient queries are the backbone of a fast, responsive dashboard. Start by filtering data, then join it, and finally aggregate. Avoid using SELECT * - instead, choose specific columns to reduce the amount of processed data. This is especially critical in large-scale environments where heavy queries can slow things down.
As your monitoring needs expand, review the Account Requirements section to select a plan that matches your metric volume and retention requirements. MetricFire's pricing model doesn't include per-user fees, so your entire team can access dashboards at no additional cost.
For teams spread across multiple locations, host data closer to users to reduce latency. MetricFire promises 99.95% system uptime and can reduce infrastructure costs by up to 75% compared with building and maintaining your own monitoring setup.
Conclusion
Creating custom dashboards with MetricFire gives you precise control over your infrastructure monitoring. From tracking Kubernetes clusters to managing cloud environments or Docker containers, you now have the tools to build, customize, and set up alerts on dashboards tailored to your specific needs.
These dashboards are more than just tools - they're key to spotting bottlenecks, planning for growth, and addressing issues before they affect users.
On the financial side, tailored monitoring can lead to significant savings and growth. It can reduce infrastructure costs by up to 75% and boost revenue by up to 25% through improved trend analysis and usage forecasting. Plus, MetricFire's pricing is straightforward - charging only for unique time-series metric names, with no extra costs for users, integrations, or sharing dashboards.
Start small by focusing on your most essential metrics. As your needs grow, MetricFire easily scales without requiring extra effort from you.
FAQs
What are the main advantages of using MetricFire for creating custom dashboards?
MetricFire simplifies the process of building custom dashboards by integrating powerful visualization tools like Grafana. This gives you the ability to create dashboards that fit your exact monitoring needs, whether you're keeping an eye on Kubernetes clusters, cloud environments, or Docker containers. The outcome? Dashboards that are not only visually clear but also tailored to enhance how you monitor your infrastructure and applications.
The platform makes it easy to connect data sources, design dashboards, and manage them efficiently. It also offers practical guides and best practices to help you get up and running quickly. With features like alerting, plugins, and the ability to import or export dashboards, MetricFire equips you with everything needed to keep your IT infrastructure running smoothly. Its user-friendly approach and adaptability make it a solid option for crafting personalized monitoring setups.
How can I select the best MetricFire plan for my monitoring needs?
Choosing the right MetricFire plan comes down to your monitoring needs - things like the size of your infrastructure, the number of metrics you want to track, and the level of support you require. For example, if you're managing Kubernetes clusters, cloud platforms like AWS, Azure, or GCP, or even Docker containers, these factors can guide your decision.
If you're unsure where to start, reaching out to MetricFire's support or sales team is a smart move. They can help assess your specific needs and recommend the plan that aligns best with your goals.
What types of visualizations can I create using Grafana with MetricFire?
With Grafana in MetricFire, you have plenty of options to visualize and track your data. Popular choices include graphs, gauges, single stat panels, tables, and alert lists. These work well for keeping tabs on metrics like system performance, resource usage, or application health.
If you're tackling more specialized tasks, Grafana also offers advanced visualizations like heatmaps, histograms, and even custom plugins. These are perfect for building dashboards tailored to unique needs, such as monitoring Kubernetes clusters, cloud services, or Docker containers. By mixing and matching these tools, you can design dashboards that give you clear, actionable insights into how your systems and applications are running.
Sign up for the free trial and begin monitoring your infrastructure today. You can also book a demo and talk to the MetricFire team directly about your monitoring needs.

