

Table of Contents
- What Is the MetricFire MCP Server?
- Step 1: Connect Your AI Assistant to MetricFire
- Step 2: Prepare Your Application Metrics
- Step 3: Create a Grafana Dashboard with One Prompt
- Step 4: Create a Composite Alert Using the Same Metrics
- Why Use AI for Dashboard Creation and Alerting?
- From Metrics to Actionable Monitoring in Two Prompts
- Get Started with the MetricFire MCP Server
Great systems are not just built. They are monitored.
MetricFire runs Graphite and Grafana as a fully managed service, handling storage, scaling, and version updates so you don't have to. Plans start at $19/month, billed per metric namespace rather than per host, with engineer-staffed support. Native integrations include Heroku, AWS, Azure, GCP, StatsD, DigitalOcean, and more. MetricFire is SOC 2 certified, with data stored at 3× redundancy in ISO/IEC 27001:2022 certified data centres.
Creating monitoring dashboards usually involves searching through metrics, selecting relevant data, configuring Grafana panels, and organizing visualizations into something useful. Setting up alerts requires additional decisions about thresholds, conditions, and notification channels.
What if you could do all of that using just a couple of natural-language prompts?
With the MetricFire MCP Server, you can connect compatible AI assistants, including Claude Code, to your Hosted Graphite monitoring data and use AI to create Grafana dashboards and manage alerts.
In this tutorial, we'll demonstrate how to turn 20 application metrics into a complete performance monitoring dashboard and then create a Composite Alert using the same data.
Prefer watching the tutorial? Watch our step-by-step video on YouTube.
What Is the MetricFire MCP Server?
The MetricFire MCP Server connects AI clients to Hosted Graphite through the Model Context Protocol (MCP), allowing AI assistants to interact with your monitoring data using natural-language instructions. Rather than switching between monitoring tools and manually configuring everything, you can ask your AI assistant to perform tasks such as:
- Searching and exploring metrics stored in Hosted Graphite
- Retrieving and analyzing monitoring data
- Creating and managing Grafana dashboards
- Creating, updating, and managing alerts
- Configuring Composite Alerts with AND/OR conditions
- Associating alerts with existing notification channels
The MCP Server provides access to Hosted Graphite API functionality through tools that compatible AI clients can use to carry out these operations. For more information, visit the MetricFire MCP Server documentation.
Step 1: Connect Your AI Assistant to MetricFire
Before creating dashboards, you'll need to connect a compatible AI client to your MetricFire account. For this demonstration, we're using Claude Code, although the MCP Server is designed to work with other compatible AI clients.
The initial setup involves creating an MCP token in Hosted Graphite, configuring your AI client to connect to the MetricFire MCP endpoint, and granting the appropriate permissions for the actions you want to perform. Once connected, your AI assistant can use the available MCP tools to discover metrics and interact with your monitoring resources.
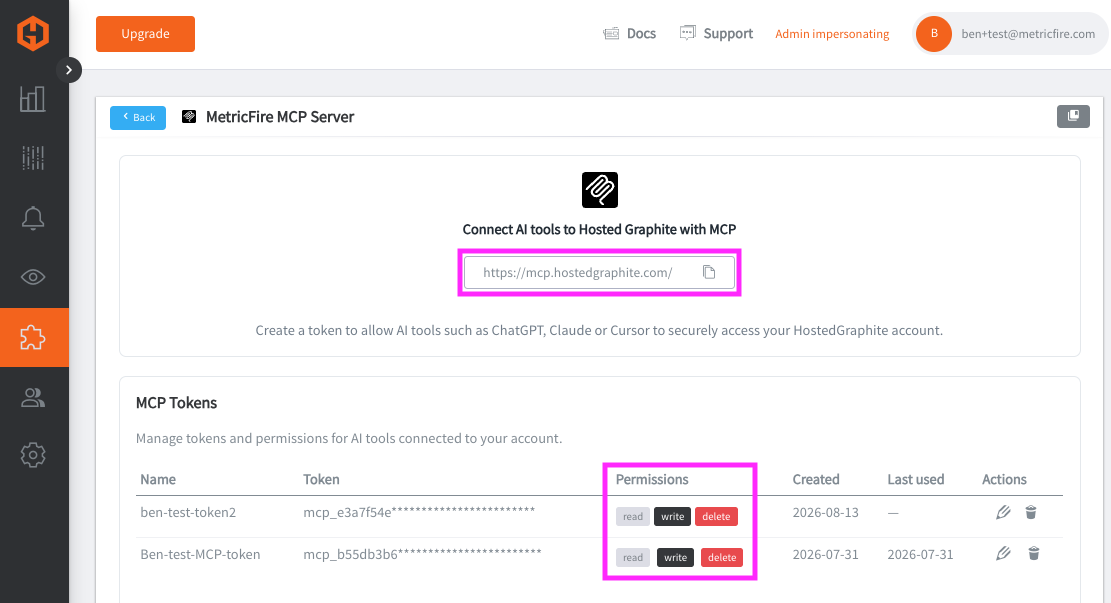
For detailed connection instructions, including token creation and configuration, follow the MCP Server setup guide.
Step 2: Prepare Your Application Metrics
For this example, we're sending 20 sample metrics to Hosted Graphite under the namespace: demo.production.*
demo.production.api.cpu.used_percent
demo.production.api.errors.rate
demo.production.api.latency.p50
demo.production.api.latency.p95
demo.production.api.latency.p99
demo.production.api.memory.used_percent
demo.production.api.requests.rate
demo.production.app.transactions.rate
demo.production.app.users.active
demo.production.cache.hit_rate.percent
demo.production.cache.memory.used_percent
demo.production.database.connections.active
demo.production.database.connections.waiting
demo.production.database.cpu.used_percent
demo.production.database.query_latency.p95
demo.production.jobs.failures.rate
demo.production.jobs.processing.rate
demo.production.jobs.queue.depth
demo.production.loadbalancer.errors.rate
demo.production.loadbalancer.requests.rate
These metrics simulate typical production application behavior across several important monitoring categories:
| Metric category | What we're monitoring |
|---|---|
| Application traffic | Request volume and traffic patterns |
| API performance | Response times, errors, and application health |
| Infrastructure | CPU and memory utilization |
| Database | Database performance and health |
| Cache | Cache performance and efficiency |
| Background jobs | Background processing activity |
This provides enough sample data to create a useful application performance overview without having to specify the individual Grafana panels ourselves. In a real production environment, you could apply the same approach to your application, servers, cloud infrastructure, or custom metrics.
Step 3: Create a Grafana Dashboard with One Prompt
With Claude Code connected to the MetricFire MCP Server, we're ready to create our dashboard.
Instead of specifying exactly which metrics to use, which visualizations to create, or how the dashboard should be organized, we'll give Claude a more open-ended instruction.
Our dashboard creation prompt:
Create a performance monitoring dashboard named App Performance MCP, using my demo.production.* metrics. Organize related metrics logically for an engineer investigating performance issues, choose appropriate visualizations and units, and make important signals and correlations easy to identify.
That's it. Claude can use the MetricFire MCP tools to search the available metrics, inspect the data, and create a Grafana dashboard using the Hosted Graphite dashboard APIs.
The important distinction is that we're describing the monitoring outcome we want, rather than manually defining every step required to build it.
What Did Claude Create?
After Claude finishes, we can open Hosted Graphite, refresh our dashboards, and inspect the result.
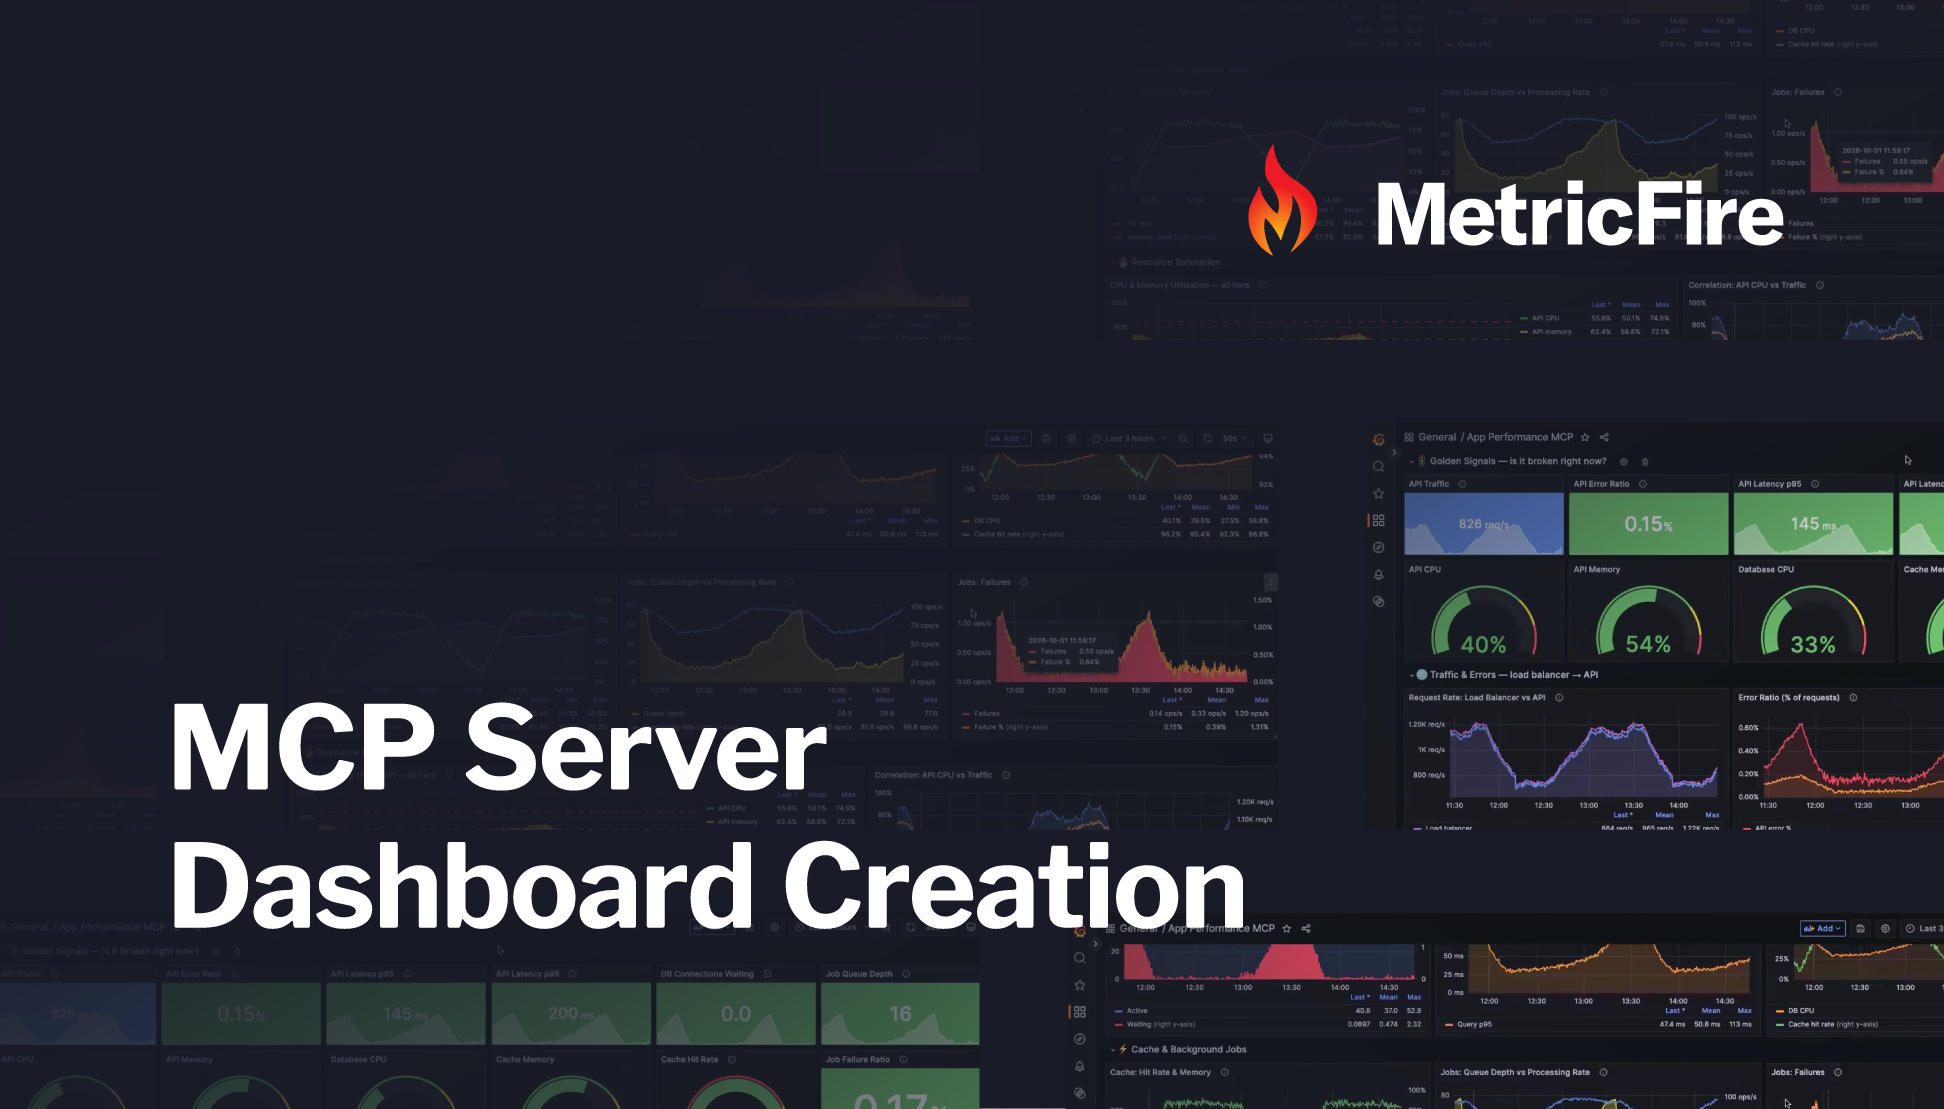
From that single prompt, Claude created a complete application performance dashboard with several useful features.
High-level health indicators
At the top of the dashboard, Claude placed important health indicators to provide an immediate overview of application performance.
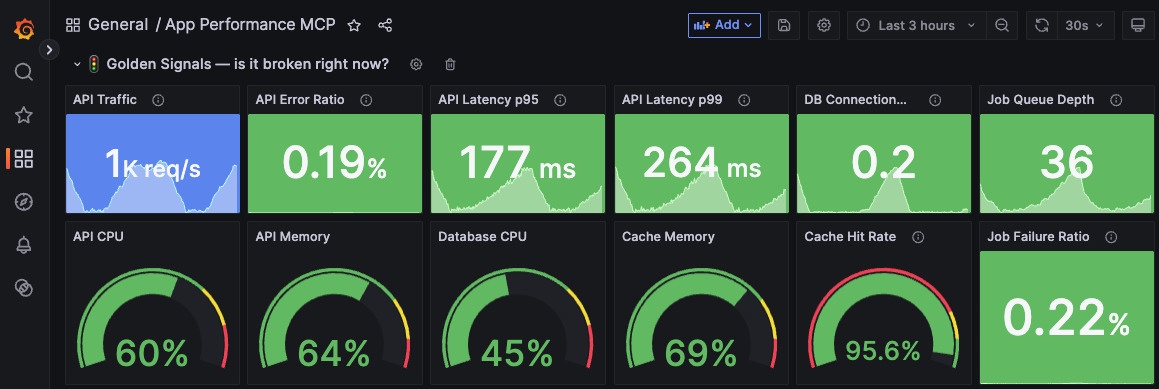
These panels make it easier to identify potential issues without searching through individual metrics.
Logically organized monitoring panels
Rather than displaying all 20 metrics in an arbitrary order, Claude grouped related data into sections covering:
- Application traffic and request errors
- API performance
- CPU and memory utilization
- Database and cache performance
- Background jobs
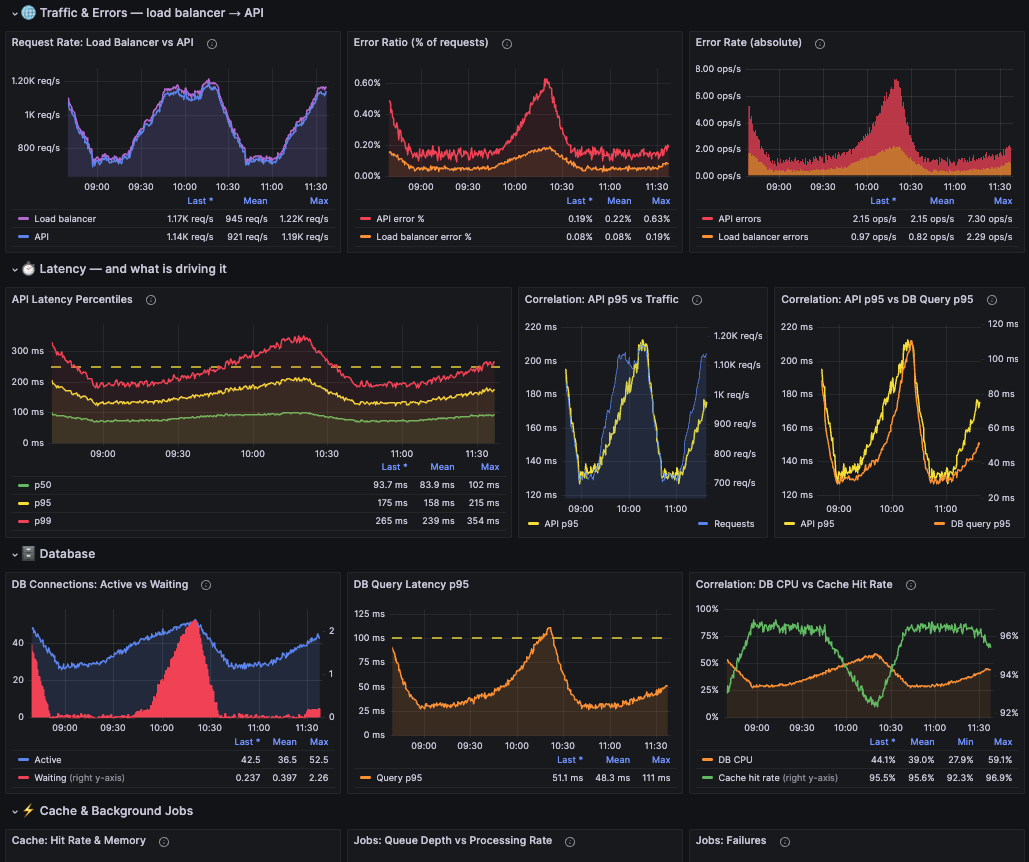
This organization makes the dashboard more useful for engineers investigating application performance problems.
Appropriate visualizations, units, and thresholds
Claude also selected relevant visualizations, configured appropriate measurement units, and added reasonable thresholds.
It even calculated an API error ratio, turning existing monitoring data into an additional signal for evaluating application health.
The result was a Grafana dashboard that could be used immediately as a starting point for performance investigations. And because it's a normal Hosted Graphite Grafana dashboard, we can continue adjusting the panels, visualizations, and thresholds as needed.
Step 4: Create a Composite Alert Using the Same Metrics
Now that we've created our performance dashboard, let's use the same metrics to configure alerting. MetricFire's Composite Alerting feature allows you to combine multiple monitoring conditions using AND/OR logical expressions. So instead of triggering separate notifications whenever an individual metric crosses a threshold, Composite Alerts can evaluate combinations of signals that indicate a more meaningful service-level problem.
For example, elevated CPU usage might not be particularly concerning on its own. But elevated CPU usage alongside increasing API response times and database issues could indicate a more serious performance problem.
Composite Alerts help reduce unnecessary notifications while providing additional context when something needs attention.
Create the Alert with a Natural-Language Prompt
For our demonstration, we'll ask Claude to choose relevant metrics and create a Composite Alert automatically.
Our Composite Alert creation prompt:
Create a composite alert named Prod Alert MCP from my demo.production.* metrics. Use four high-value signals, with sensible criteria and thresholds, and use AND/OR logical expressions so the alert only fires for a meaningful service-level issue. Send it to my existing Slack notification channels.
Notice that we haven't specified the individual metrics, threshold values, or exact logical expression. We're simply asking Claude to evaluate the available monitoring data and propose a useful alert configuration.
Using the MetricFire MCP tools, Claude can search the metrics, select relevant signals, and create an alert through the Hosted Graphite alerting APIs.
Review the Generated Alert
Once Claude finishes, we can navigate to the Alerts section in Hosted Graphite to review the configuration.
In our demonstration, Claude selected useful API, database, and CPU signals, configured threshold conditions with evaluation periods, and combined them into a service-level alert. It also associated the alert with both existing Slack notification channels in the account.
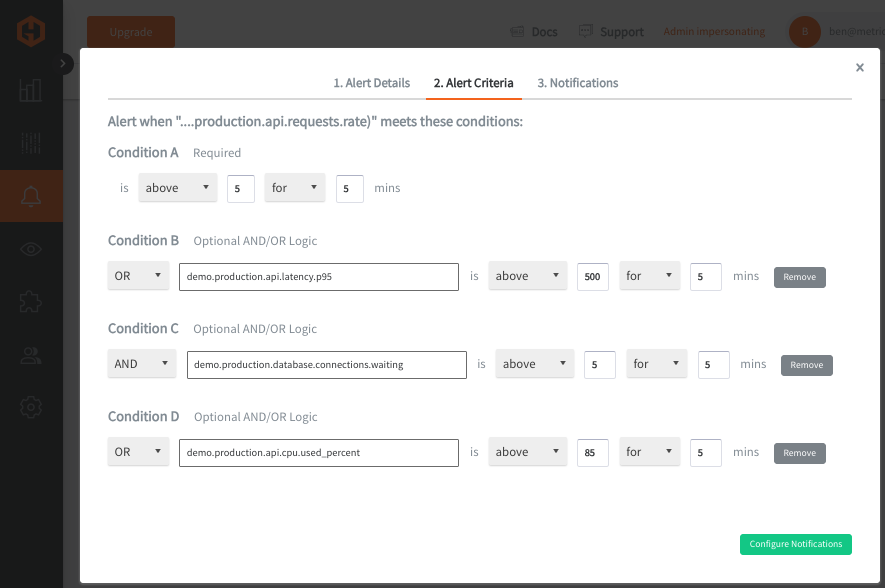
As with the dashboard, the alert criteria and thresholds can be reviewed and fine-tuned.
Important: AI-generated thresholds and logical conditions should always be checked against your application's normal operating behavior before relying on them in production. A useful starting configuration isn't necessarily the final configuration for every environment. Learn more about Composite Alerting best practices in the MetricFire blog.
Why Use AI for Dashboard Creation and Alerting?
The value of AI-assisted observability isn't simply generating dashboards faster. It's reducing the manual work required to turn monitoring data into something actionable.
1. Spend Less Time Building Dashboards
Creating a Grafana dashboard manually involves selecting metrics, configuring queries, choosing visualizations, setting units, and organizing panels.
With the MetricFire MCP Server, you can describe the dashboard you need and let your AI client handle much of the initial configuration.
2. Discover Useful Metrics More Easily
Production environments can contain hundreds or thousands of metrics.
Rather than navigating an entire metric hierarchy yourself, you can ask your AI assistant to find the metrics associated with a particular application, service, host, or infrastructure component.
3. Create More Meaningful Alerts
Combining multiple signals through Composite Alerting helps engineers focus on conditions that are more likely to indicate genuine service problems.
The MCP Server makes it easier to begin configuring these alerts through natural-language prompts.
4. Keep Monitoring Within Your AI Workflow
For engineers already using AI-assisted development tools, MCP provides a way to work with monitoring data without constantly switching between applications.
You can explore metrics, create dashboards, and manage alerts from your existing AI client, while Hosted Graphite continues to provide the underlying monitoring infrastructure.
5. Maintain Control Over the Results
AI-generated dashboards and alerts are starting points, not replacements for engineering judgment.
You can inspect, modify, and refine the generated configurations in Hosted Graphite to ensure they match your monitoring requirements.
From Metrics to Actionable Monitoring in Two Prompts
In this tutorial, we started with 20 example application metrics and two natural-language instructions.
With the first prompt, Claude Code used the MetricFire MCP Server to create a complete Grafana dashboard, including logically grouped panels, appropriate units, thresholds, and an API error ratio.
With the second prompt, it created a Composite Alert using multiple performance signals and connected the alert to existing Slack notification channels.
The result demonstrates how AI-assisted workflows can make infrastructure and application monitoring more accessible while reducing repetitive configuration work.
As AI tools become more integrated into development and operations, the MetricFire MCP Server provides a practical way to connect those tools to your actual monitoring data.
Get Started with the MetricFire MCP Server
Ready to try creating Grafana dashboards and alerts with AI?
MetricFire combines Hosted Graphite, Grafana dashboards, Composite Alerting, and MCP integration to help teams monitor their infrastructure and applications.
Start exploring AI-assisted observability today:
- Start your free 14-day MetricFire trial
- Read the MetricFire MCP Server documentation
- Learn more about Composite Alerting
- Watch the full MCP dashboard creation tutorial
Have questions about connecting your AI client or creating your first dashboard? Contact our team at support@metricfire.com