

Table of Contents
- Introduction
- What Is Model Context Protocol?
- Connecting to the MetricFire MCP Server
- Infrastructure Monitoring with MetricFire’s MCP
- Search for MySQL metrics using natural language
- Render Graphite data through Copilot
- Visualize a metric as a PNG
- Create a composite (conditional) alert
- Add a Slack notification channel
- Mute the alert on weekends
- HTTP Dashboard Compatibility (coming soon)
- MetricFire MCP Configuration - Video Tutorial
- Why MCP Is Useful for Infrastructure Monitoring
- From Metric Search to Alert Configuration in Minutes
- Conclusion
Great systems are not just built. They are monitored.
MetricFire runs Graphite and Grafana as a fully managed service for growing engineering teams, taking care of storage, scaling, and version updates so your team doesn't have to. Plans start at $19/month, billed per metric namespace rather than per host, and include engineer-staffed support. Integrations work natively with Heroku, AWS, Azure, and GCP, and data is stored with 3× redundancy in SOC2- and ISO:27001-certified data centres.
Introduction
Model Context Protocol (MCP) is making it easier for development teams to connect AI assistants directly to the tools and platforms they use every day. Instead of manually navigating APIs, searching through metric names, or configuring monitoring rules field by field, teams can use natural-language prompts to perform many of those tasks.
MetricFire's Hosted Graphite now has it's own MCP server, allowing AI clients to interact directly with Hosted Graphite's various API's. In this tutorial, we’ll connect MetricFire's MCP server to GitHub Copilot in VS Code, then use natural-language prompts to interact with a Hosted Graphite account and:
- Search for stored metric patterns
- Render Graphite data
- Visualize infrastructure metrics
- Create a composite (conditional) alert
- Add a Slack #notification-channel
- Schedule an alert mute (for weekends)
The MCP integration can also be used with other compatible AI clients, including Claude/Claude Code, Cursor, Cline, Windsurf, and more!
What Is Model Context Protocol?
MCP is an open standard that allows AI assistants to connect to external tools, services, and data sources through a common interface. Instead of building a custom integration for every AI client and API, an MCP server exposes a set of tools that compatible AI assistants can discover and use based on a user's natural-language request.
For SRE and DevOps workflows, this means an AI assistant can do more than explain monitoring concepts or generate API requests. With the appropriate permissions, it can interact directly with your monitoring platform and the data already available there. For example, instead of manually searching for metrics or constructing a request against the Hosted Graphite API, you could ask: "Search for metrics related to MySQL running threads and row lock waits." The AI assistant can identify the appropriate Hosted Graphite MCP tool, execute the request, and return the results directly in the conversation.
This makes MCP useful for developers and DevOps teams that want to investigate metrics, visualize infrastructure behavior, manage alerts, and perform other monitoring tasks without leaving their existing AI workflow.
Connecting to the MetricFire MCP Server
For this example, we’ll connect Hosted Graphite to GitHub Copilot using VS Code.
1. Create an MCP token in the Hosted Graphite app
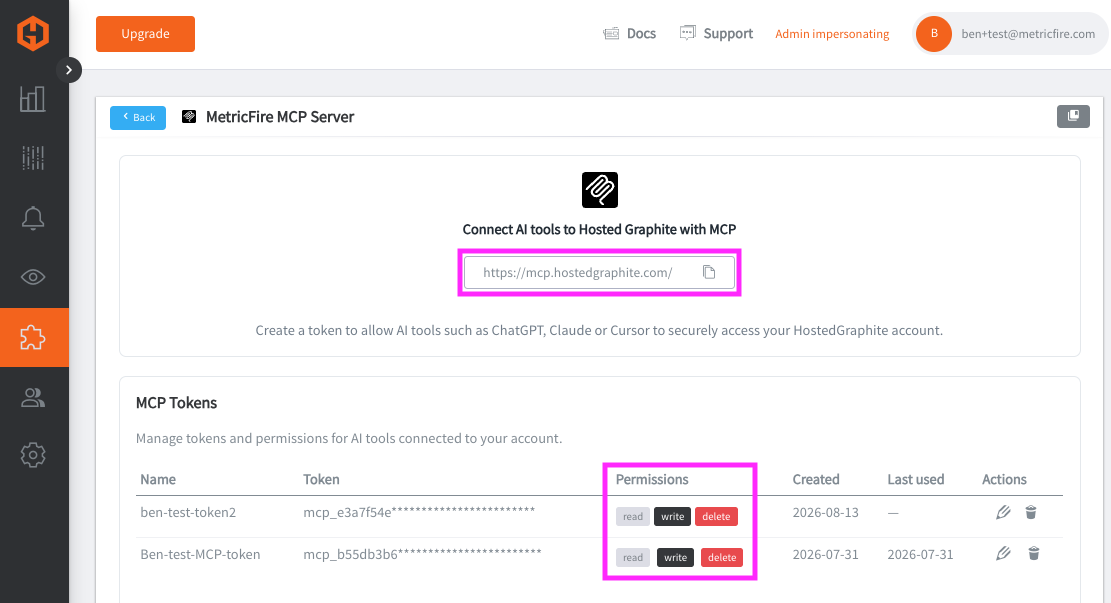
Log in to your Hosted Graphite account and navigate to Add-Ons => MetricFire MCP Server. Create a new token and select the permissions you want to grant to the MCP client. Copy the token when it is created, as you’ll use it to authenticate your MCP server connection. As with any API credential, only grant the permissions required and keep the token private.
2. Open the MCP configuration in VS Code
In VS Code, press Command + Shift + P to open the Command Palette, then search for MCP: Open User Configuration and VS Code will open the MCP configuration file for your user.
3. Add the MetricFire MCP server
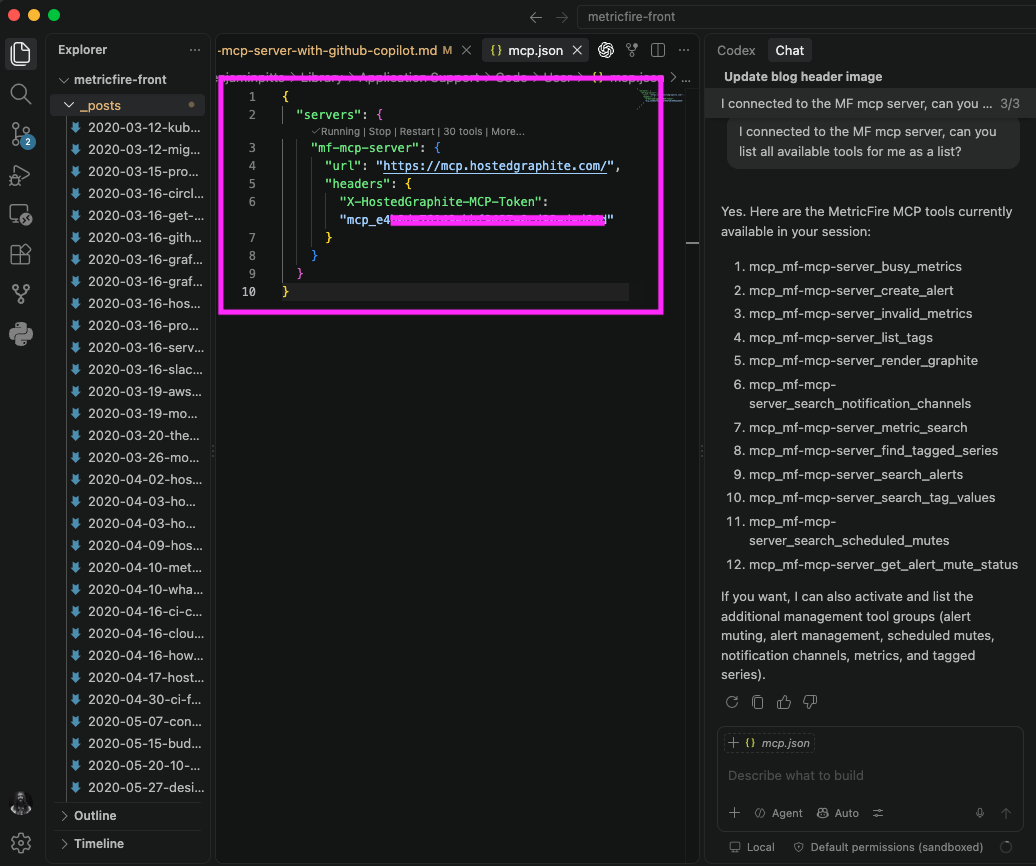
Add the Hosted Graphite MCP server endpoint and your newly created token to the configuration:
{
  "servers": {
    "mf-mcp-server": {
      "url": "https://mcp.hostedgraphite.com/",
      "headers": {
        "X-HostedGraphite-MCP-Token": "YOUR_MCP_TOKEN"
      }
    }
  }
}
Replace YOUR_MCP_TOKEN with the token generated in Hosted Graphite, then save the configuration. VS Code should recognize the Hosted Graphite MCP server. Click Start and confirm that its status changes to Running. Then you can begin interacting with the server in a Copilot Chat, you could start by asking it something like: "List all available Hosted Graphite tools".
Important: Never publish or commit your MCP token to a public repository!
Infrastructure Monitoring with MetricFire's MCP
Once connected, your AI client can combine Hosted Graphite API tools to investigate infrastructure, visualize metrics, and manage monitoring resources directly from a conversation in an ongoing chat. Some useful starting points include:
- Discover relevant metrics: "Find metrics related to CPU, memory, and disk usage for my web servers."
- Investigate behaviors: "Find the busiest metrics in my account and show me what changed over the last hour."
- Visualize metric data: "Render CPU usage for my production servers over the last 24 hours."
- Create and manage alerts: "Create an alert when CPU usage stays above 90% for 10 minutes."
- Manage alerting workflows: "Send a notification to my Slack channel when this alert triggers, and mute it on weekends."
These tools can also be combined in a single workflow, allowing an AI assistant to discover metrics, inspect their behavior, and configure monitoring based on what it finds. The MF MCP server depends on metrics that have already been forwarded to the HG carbon endpoint and stored in the HG backend.
Search for MySQL metrics using natural language
Suppose we want to investigate one of our database servers, db-0002. Instead of manually browsing metric names in HG's Metrics Search UI, we can just ask Copilot:
"Search metrics for the pattern: db-0002.* related to MySQL running threads and row lock waits"
Copilot recognizes this as a grouped/wildcard metric search request and uses the appropriate HG metric search tool. It can then return metrics corresponding to the concepts in the prompt, such as MySQL running threads and InnoDB row lock waits.
This is useful when you know what you want to investigate, but don’t remember the exact Graphite metric path. In a production environment, the same approach can help engineers quickly discover relevant metrics across databases, application servers, Kubernetes workloads, cloud infrastructure, and other monitored services without having to know the exact naming convention ahead of time.
Render Graphite data through Copilot
Once we’ve identified the relevant metric, we can ask Hosted Graphite to render its recent values. For example:
"Render JSON data for the last 15min of MySQL Threads_running on db-0002"
Copilot can use the Hosted Graphite render tool to retrieve the requested data. Depending on the request, Graphite data can be returned as JSON, CSV, raw values, or a rendered image.
In a production investigation, this provides a quick way to move from metric discovery to the underlying time-series data. An engineer investigating database latency, high CPU, memory pressure, request errors, or another incident can retrieve a relevant time range without manually constructing a Render API request.
Visualize a metric as a PNG
MCP can also be used to quickly visualize a metric. For example:
"Render and display the 1 minute load AVG for db-0002 over the last 24hrs, as a PNG"
This gives us a quick view of the server’s recent load behavior. Looking at the historical range of a metric can also help when deciding what should count as abnormal behavior before creating an alert.
This same workflow can be useful during a production investigation when you want to quickly visualize a spike, compare current behavior with a longer time range, or determine whether an unusual value is actually outside the normal operating range. The metric can be discovered and visualized without leaving the AI client.
Create a composite (conditional) alert
Metric search and rendering are useful, but MCP becomes especially powerful when it can also help configure monitoring. For this example, we’ll create a Composite Alert for DB service health.
Composite alerts let you combine multiple metric conditions using AND/OR logic. That can provide a more complete picture of service health than alerting on one isolated metric. We’ll ask Copilot:
"Create a COMPOSITE alert named "DB Service Health" for db-0002 with this criteria: MySQL Threads_running > 3 for 10m, OR InnoDB row lock waits > 0 EVER, OR 1m load average > 1 for 10m"
This service-level alert combines several different warning signs: excessive MySQL thread activity, InnoDB row lock contention, and high underlying server load. Copilot can interpret the requested conditions, select the Hosted Graphite alert creation tool, and build the composite alert.
In a production stack, the same approach can be used to define service health across multiple signals. For example, a composite alert could combine application errors, request latency, database health, and host resource usage so that alerting reflects the broader state of a service rather than a single metric in isolation.
Afterward, you can refresh the HG alerts page and inspect the newly created rule.
Add a Slack notification channel
Creating an alert is only part of the workflow. We also want the right people to know when it fires. If an existing Slack notification channel is already configured in Hosted Graphite, we can ask Copilot to attach it to the alert:
"Add my Slack #notification-channel to the new alert"
Copilot can use the HG Notification Channels tool to update the alert configuration with the notification channel. In a production environment, this makes it possible to create an alert and connect it to an existing team or incident channel as part of the same workflow, rather than configuring each resource separately.
Mute the alert on weekends
We can go one step further and configure a Scheduled Mute:
"Mute this alert on weekends (Sat/Sun)"
Copilot can create a Scheduled Mute rule and apply it to the alert. After refreshing the HG alerts page, you can verify that both the Slack notification channel and weekend Scheduled Mute have been applied.
Scheduled mutes are particularly useful for known maintenance windows or periods when a service is intentionally unavailable. In a production environment, an engineer can configure these alongside the alert itself to reduce unnecessary notifications while keeping the underlying monitoring and alert configuration in place.
HTTP Dashboard Compatibility (coming soon)
We’re also working on adding Hosted Graphite dashboard APIs to the MCP server. This will allow AI clients to reference metrics in your account and use them to create and manage Grafana dashboards, extending the same natural-language workflow from metric discovery and alerting to dashboard creation and visualization!
MetricFire MCP Configuration - Video Tutorial
Everything covered in this article is also available in step-by-step a video tutorial:
Why MCP Is Useful for Infrastructure Monitoring
The MetricFire MCP server provides a natural-language interface between AI assistants and monitoring workflows.
For development and infrastructure teams, that can reduce the amount of time spent on repetitive tasks such as finding exact metric paths, assembling API requests, or navigating configuration forms.
A developer can move from a question like:
"What metrics do we have for this database?"
to:
"Show me its load over the last 24 hours."
and then:
"Create an alert when these three conditions indicate the database may be unhealthy."
All within the same AI-assisted workflow. MCP doesn’t replace the underlying monitoring platform or its APIs. Instead, it gives developers another way to interact with them, which can be especially convenient during investigation, troubleshooting, and configuration.
From Metric Search to Alert Configuration in Minutes
In this example, we connected Copilot to the MetricFire MCP Server and used it to:
- Search for relevant MySQL and infrastructure metrics using natural language
- Retrieve recent time-series data through the Graphite Render API
- Visualize server load over a longer time range
- Create a composite database health alert using multiple monitoring signals
- Connect the alert to an existing Slack notification channel
- Configure a weekend Scheduled Mute to control when notifications are sent
Together, these steps demonstrate how an AI assistant can move from investigating production infrastructure to configuring monitoring around what it finds, without manually searching metric namespaces or constructing individual API requests.
The Hosted Graphite MCP integration provides a conversational interface to the metrics, Graphite rendering, alerting, and notification capabilities already available in your Hosted Graphite account. The same workflow can be applied across databases, application servers, Kubernetes workloads, cloud infrastructure, and other services in your monitoring stack.
If there are additional Hosted Graphite API tools you’d like to see supported through MCP, we’d love to hear your feedback.
You can also start a FREE 14-day MetricFire trial to try the Hosted Graphite monitoring platform for yourself. If you have questions about getting connected to the MCP server, contact us at support@metricfire.com.
Conclusion
MCP gives SRE and DevOps teams a practical way to bring AI-assisted workflows into infrastructure monitoring. By giving AI clients controlled access to monitoring APIs, engineers can move more quickly from discovering metrics and investigating infrastructure behavior to building the alerts, visualizations, and notification workflows needed to monitor it.
This can be especially valuable as infrastructure grows more complex. Instead of spending time navigating between tools, remembering metric paths, or manually constructing API requests, teams can use natural language to interact with the monitoring data and resources they already have. The engineer remains in control of the monitoring strategy, while the AI client helps handle many of the repetitive steps required to implement it.
Tools like MCP have the potential to significantly shorten the path from deploying infrastructure to having meaningful monitoring around it, helping SRE and DevOps teams build and iterate on observability stacks faster than ever before.