

Table of Contents
Great systems are not just built. They are monitored.
MetricFire runs Graphite and Grafana as a fully managed service for growing engineering teams, taking care of storage, scaling, and version updates so your team doesn't have to. Plans start at $19/month, billed per metric namespace rather than per host, and include engineer-staffed support. Integrations work natively with Heroku, AWS, Azure, and GCP, and data is stored with 3× redundancy in SOC2- and ISO:27001-certified data centres.
Introduction
One of the best things about DigitalOcean is that it makes infrastructure easy to deploy and manage. Whether you are running a single Droplet or a production environment with databases, load balancers, and autoscaling, DigitalOcean exposes a large collection of performance metrics through its Monitoring API.
The challenge is not getting access to the data. It is knowing which metrics actually deserve your attention. Some metrics are great for troubleshooting after something breaks. Others can give you an early warning that a server, database, or application is starting to struggle before your users notice anything.
In this article, we look at some of the most useful DigitalOcean metrics, why they are worth monitoring, and how they can help you keep your infrastructure healthy.
Start with the Fundamentals
The DigitalOcean Monitoring API exposes hundreds of infrastructure metrics across Droplets, Databases, Apps, Load Balancers, and Autoscale Pools. Rather than trying to monitor everything, it is usually more effective to focus on a handful of metrics that provide the clearest picture of system health.
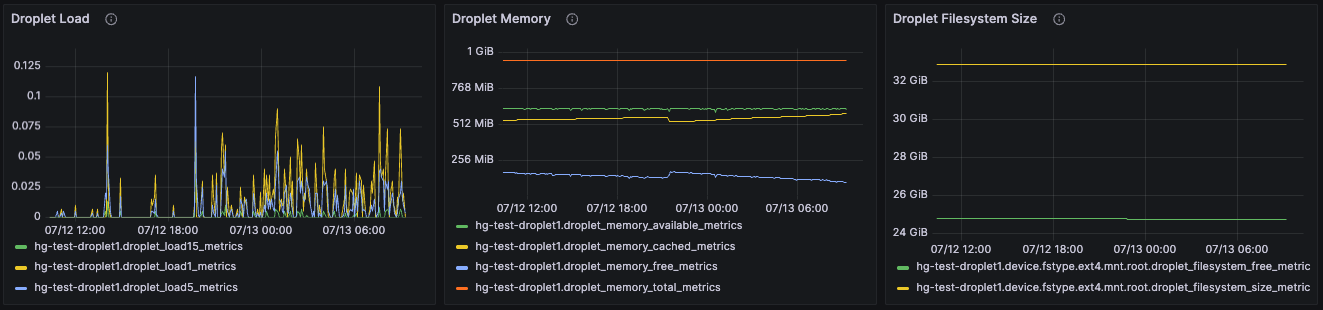
For Droplets, CPU utilization is one of the first places to start. The API exposes this through the cpu metric, while system load is available through load_1, load_5, and load_15. Together, these metrics help determine whether a server is comfortably handling its workload or beginning to struggle.
Memory utilization is equally important. Metrics such as memory_available, memory_free, memory_cached, and memory_total can quickly reveal memory pressure or applications that simply require additional resources.
Storage shouldn't be overlooked either. Filesystem metrics including filesystem_size and filesystem_free make it easy to identify servers that are slowly running out of disk space before applications begin failing.
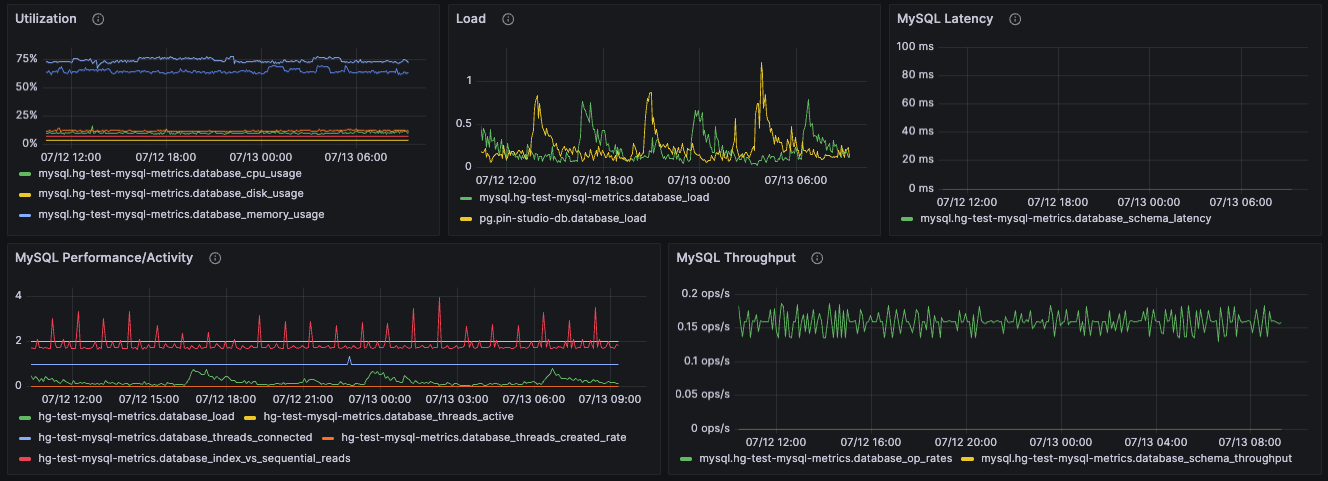
For Managed Databases, DigitalOcean provides metrics including database_cpu_usage, database_memory_usage, database_disk_usage, database_load, database_threads_connected, database_threads_active, database_schema_latency, and database_schema_throughput. These metrics provide an excellent overview of database health and often explain application performance issues long before users notice them.
Understand How Your Applications Behave
Healthy infrastructure does not always mean healthy applications.
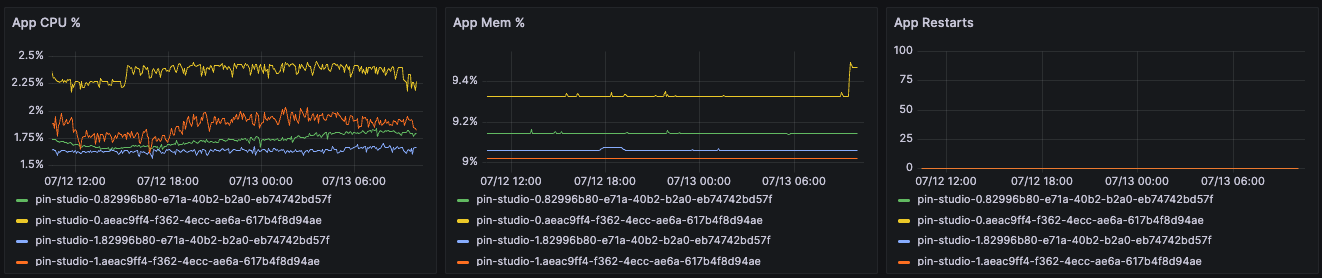
DigitalOcean App Platform exposes metrics including app_cpu_percentage, app_memory_percentage, and app_restart_count for each application instance. These provide a simple but effective view into application health. Unexpected restart counts, in particular, are often an early indicator of deployment issues or resource exhaustion.
Load Balancers expose an even richer collection of metrics. Request rates, active frontend connections, backend response times, network throughput, queue sizes, and HTTP response codes all help explain how traffic is flowing through your infrastructure.
Some particularly useful metrics include:
frontend_connections_currentfrontend_http_requests_per_secondfrontend_cpu_utilizationdroplets_http_response_time_avgdroplets_http_response_time95_pdroplets_http_response_time99_pfrontend_http_responsesdroplets_health_checks
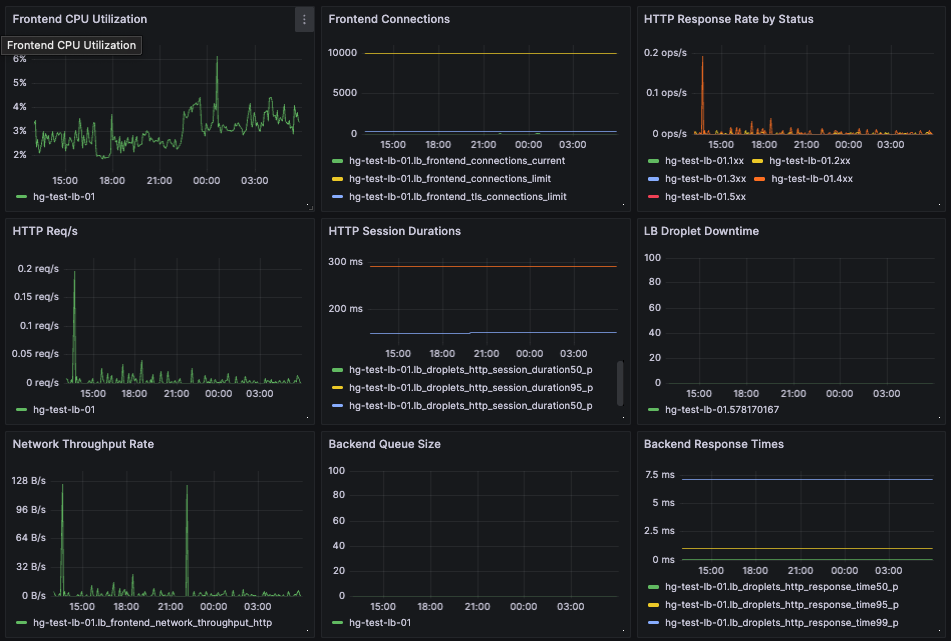
Viewed together, these metrics make it much easier to determine whether an issue originates with the load balancer itself or one of the backend services.
Watch for Trends Instead of Waiting for Problems
One of the biggest advantages of continuous monitoring is recognizing trends before they become outages.
DigitalOcean Autoscale Pools expose metrics including droplet_autoscale_current_instances, droplet_autoscale_target_instances, droplet_autoscale_current_cpu_utilization, droplet_autoscale_target_cpu_utilization, droplet_autoscale_current_memory_utilization, and droplet_autoscale_target_memory_utilization. These metrics make it easy to confirm that autoscaling policies are responding appropriately to changing workloads.
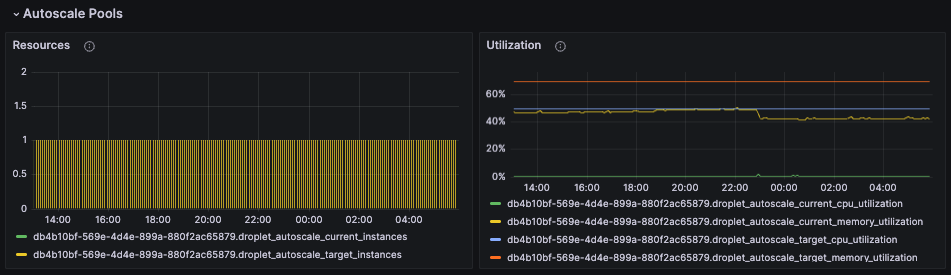
Long-term trends are just as valuable for every resource type. Gradually increasing CPU utilization, steadily decreasing available memory, growing database load, or increasing HTTP response times rarely happen all at once. Monitoring these trends over time allows teams to plan capacity, identify regressions after deployments, and resolve performance issues before they become production incidents.
The best dashboards do not rely on a single metric. They bring related metrics together, allowing you to understand the overall health of your environment at a glance instead of chasing individual graphs.
If you're using Hosted Graphite by MetricFire, getting started is straightforward. Simply generate a DigitalOcean Personal Access Token, add it to the DigitalOcean integration within Hosted Graphite, and your infrastructure metrics will be collected automatically every 10 minutes. From there, you can explore prebuilt Grafana dashboards, create custom visualizations, and configure alerts to stay informed when important metrics change.
Conclusion
DigitalOcean provides an excellent set of monitoring metrics across Droplets, Databases, Apps, Load Balancers, and Autoscale Pools. Knowing which metrics matter most makes it much easier to troubleshoot problems, plan for growth, and understand the overall health of your environment.
Hosted Graphite builds on those metrics by automatically collecting them from the DigitalOcean Monitoring API, organizing them into prebuilt Grafana dashboards, and making it easy to create alerts for the signals that matter most. Whether you are monitoring a small side project or a production environment, having all of your infrastructure metrics in one place helps you spend less time chasing problems and more time building your application.
Sign up for a free trial to start monitoring your DigitalOcean metrics in Hosted Graphite, or book a demo with our knowledgeable team.