


Table of Contents
Great systems are not just built. They are monitored.
MetricFire runs Graphite and Grafana as a fully managed service for growing engineering teams, taking care of storage, scaling, and version updates so your team doesn't have to. Plans start at $19/month, billed per metric namespace rather than per host, and include engineer-staffed support. Integrations work natively with Heroku, AWS, Azure, and GCP, and data is stored with 3× redundancy in SOC2- and ISO:27001-certified data centres.
Introduction
DigitalOcean is a popular cloud platform for teams that want to deploy applications quickly without taking on unnecessary infrastructure complexity. A typical DigitalOcean environment might include Droplets for application servers, Managed Databases for persistence, Load Balancers for traffic distribution, App Platform for managed application hosting, and Autoscale Pools for dynamic compute capacity.
As these environments grow, monitoring becomes more important. It is useful to see the health of each individual resource, but it is even more useful to correlate those metrics in one place. For example, a spike in database load may explain increased response times from an application. A failing backend health check may explain a drop in load balancer traffic. A growing autoscale pool may explain a temporary increase in CPU or memory usage.
That is why we built the Hosted Graphite DigitalOcean integration: to help users automatically pull DigitalOcean metrics into Hosted Graphite, visualize them in Grafana, and configure meaningful alerts around their infrastructure.
In this article, we walk through a practical example using a small DigitalOcean environment with an app, two databases, two Droplets, one Autoscale Pool, and one Load Balancer. We configure the Hosted Graphite integration, review the metrics collected, generate a dashboard, and create a composite alert that monitors service health across multiple resource types.
Example DigitalOcean Environment
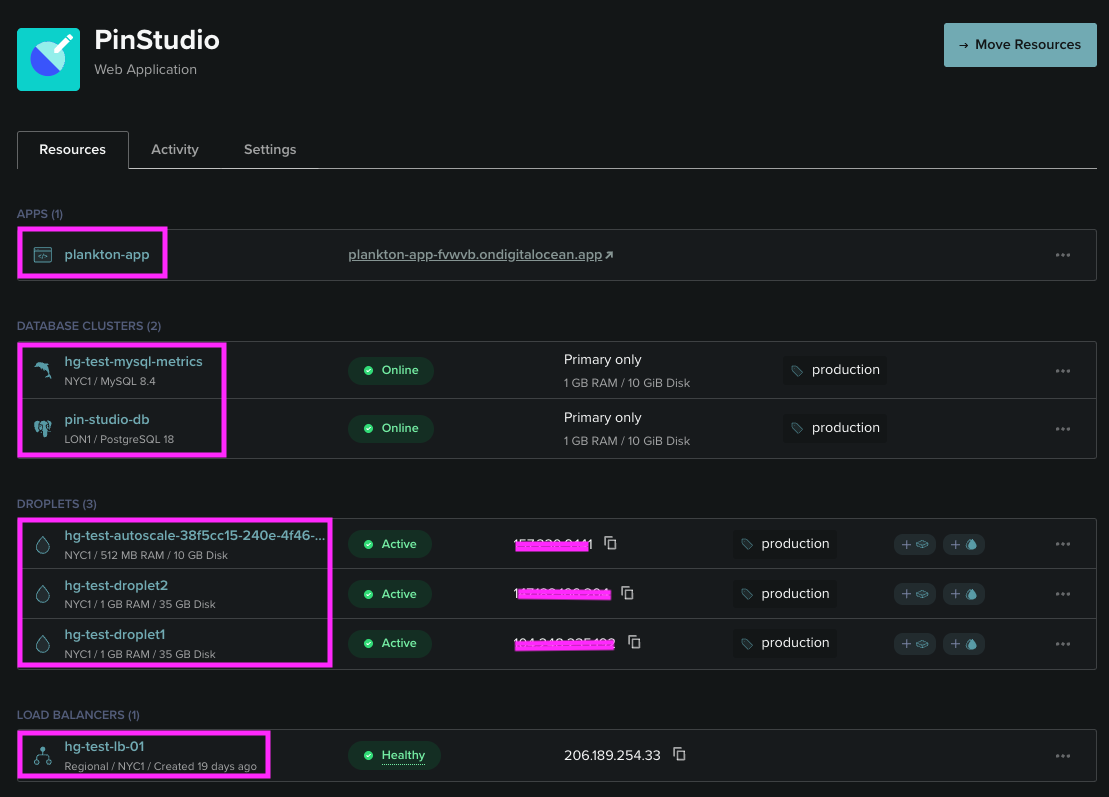
For this walkthrough, we are using a small production-style DigitalOcean setup:
- 1 App Platform app
- 2 Managed Databases: MySQL and PostgreSQL
- 2 Droplets
- 1 Droplet Autoscale Pool
- 1 Load Balancer
This is not meant to represent every possible DigitalOcean architecture, but it is a useful example because it includes several resource types that commonly support a real application.
App Platform
DigitalOcean App Platform is commonly used to deploy web applications, APIs, background workers, or static sites without managing the underlying servers directly. For teams that want a managed deployment workflow, App Platform can simplify application hosting while still exposing useful metrics such as CPU usage, memory usage, and restart counts.
These metrics are useful for identifying resource pressure, unstable deployments, or application behavior that changes after a release.
Managed Databases
Managed Databases are commonly used for application persistence. In this example, we are using both MySQL and PostgreSQL.
Database metrics are some of the most important signals in any production environment because many application issues eventually show up as database pressure. High CPU usage, rising memory usage, increased load, growing connection counts, or changes in query throughput can indicate that an application is under heavier demand or that a database needs tuning.
Droplets
Droplets are DigitalOcean virtual machines. They are often used as application servers, worker nodes, utility servers, or backend targets for a Load Balancer.
For Droplets, some of the most useful metrics include load average, memory usage, filesystem usage, and disk I/O. These metrics help answer practical questions such as:
- Is the server under CPU pressure?
- Is memory usage increasing over time?
- Is disk space running out?
- Is disk I/O affecting performance?
Autoscale Pools
Autoscale Pools help adjust compute capacity based on demand. They are useful when workloads vary throughout the day or when traffic can increase unexpectedly.
Autoscale metrics help show whether the pool is maintaining the expected number of instances, whether CPU or memory utilization is approaching target thresholds, and whether scaling behavior matches the actual workload.
Load Balancer
A Load Balancer distributes traffic across backend resources. In a production environment, it is often one of the best places to monitor application availability and user-facing performance.
Useful Load Balancer metrics include frontend connections, request rates, response code rates, backend response times, backend health checks, queue size, and backend downtime. These metrics help determine whether traffic is reaching the application, whether backend Droplets are healthy, and whether users are seeing errors or latency.
Configuring the Hosted Graphite DigitalOcean Integration
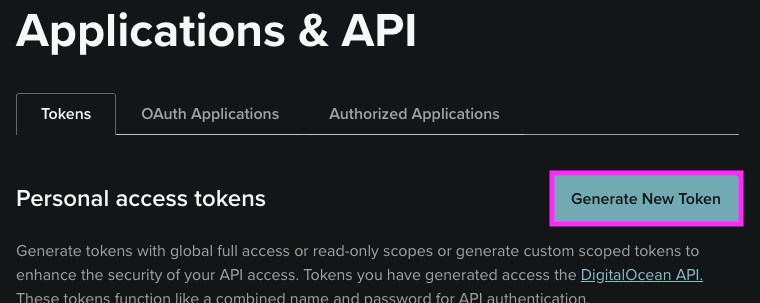
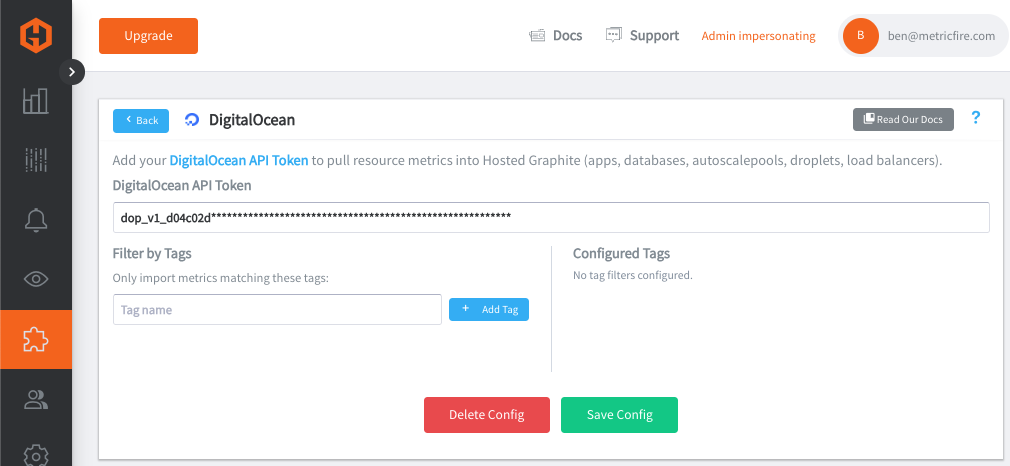
To configure the integration, you need a DigitalOcean API token with access to read metrics from your DigitalOcean account.
In the DigitalOcean control panel, create a personal access token from the API settings page. After creating the token, copy it and add it to the DigitalOcean integration configuration in Hosted Graphite.
Once the token is saved and the integration is enabled, Hosted Graphite will begin pulling metrics from the DigitalOcean Monitoring API every 10 minutes. You can optionally use tag filtering to limit which resources are collected. This is useful if your DigitalOcean account contains many projects, test resources, or temporary infrastructure that you do not want to include in your Hosted Graphite account.
After the integration runs, your DigitalOcean metrics will appear in Hosted Graphite using Graphite metric paths under the digitalocean namespace.
Available Graphite Metrics
Examples of DO resource metrics include:
digitalocean.app.owner.<owner_id>.app_component.<app_name>.instance.<instance_name>.<instance_id>.app_cpu_percentage_metrics
digitalocean.app.owner.<owner_id>.app_component.<app_name>.instance.<instance_name>.<instance_id>.app_memory_percentage_metrics
digitalocean.app.owner.<owner_id>.app_component.<app_name>.instance.<instance_name>.<instance_id>.app_restart_count_metrics

digitalocean.database.mysql.db.<db_name>.database_cpu_usage
digitalocean.database.mysql.db.<db_name>.database_memory_usage
digitalocean.database.mysql.db.<db_name>.database_disk_usage
digitalocean.database.mysql.db.<db_name>.database_load
digitalocean.database.pg.db.<db_name>.database_cpu_usage
digitalocean.database.pg.db.<db_name>.database_memory_usage
digitalocean.database.pg.db.<db_name>.database_disk_usage
digitalocean.database.pg.db.<db_name>.database_load

digitalocean.droplet.host_id.<host_id>.<droplet_name>.droplet_load1_metrics
digitalocean.droplet.host_id.<host_id>.<droplet_name>.droplet_load5_metrics
digitalocean.droplet.host_id.<host_id>.<droplet_name>.droplet_load15_metrics
digitalocean.droplet.host_id.<host_id>.<droplet_name>.droplet_memory_available_metrics
digitalocean.droplet.host_id.<host_id>.<droplet_name>.droplet_memory_free_metrics
digitalocean.droplet.host_id.<host_id>.<droplet_name>.droplet_memory_total_metrics
digitalocean.droplet.host_id.<host_id>.<droplet_name>.device.<device>.fstype.<fstype>.mnt.<mount>.droplet_filesystem_free_metrics
digitalocean.droplet.host_id.<host_id>.<droplet_name>.device.<device>.fstype.<fstype>.mnt.<mount>.droplet_filesystem_size_metrics

digitalocean.load_balancer.<lb_name>.lb_frontend_connections_current
digitalocean.load_balancer.<region>.<lb_name>.lb_frontend_http_requests_per_second
digitalocean.load_balancer.<region>.<lb_name>.<status_code_class>.lb_frontend_http_responses
digitalocean.load_balancer.<region>.<lb_name>.<status_code_class>.lb_droplets_http_responses
digitalocean.load_balancer.<region>.<lb_name>.lb_frontend_cpu_utilization
digitalocean.load_balancer.<region>.<lb_name>.lb_droplets_queue_size
digitalocean.load_balancer.<region>.<lb_name>.lb_droplets_http_response_time95_p
digitalocean.load_balancer.<region>.<lb_name>.node.<droplet_id>.lb_droplets_health_checks

digitalocean.autoscalepool.pool_id.<pool_id>.droplet_autoscale_current_instances
digitalocean.autoscalepool.pool_id.<pool_id>.droplet_autoscale_target_instances
digitalocean.autoscalepool.pool_id.<pool_id>.droplet_autoscale_current_cpu_utilization
digitalocean.autoscalepool.pool_id.<pool_id>.droplet_autoscale_current_memory_utilization
digitalocean.autoscalepool.pool_id.<pool_id>.droplet_autoscale_target_cpu_utilization
digitalocean.autoscalepool.pool_id.<pool_id>.droplet_autoscale_target_memory_utilization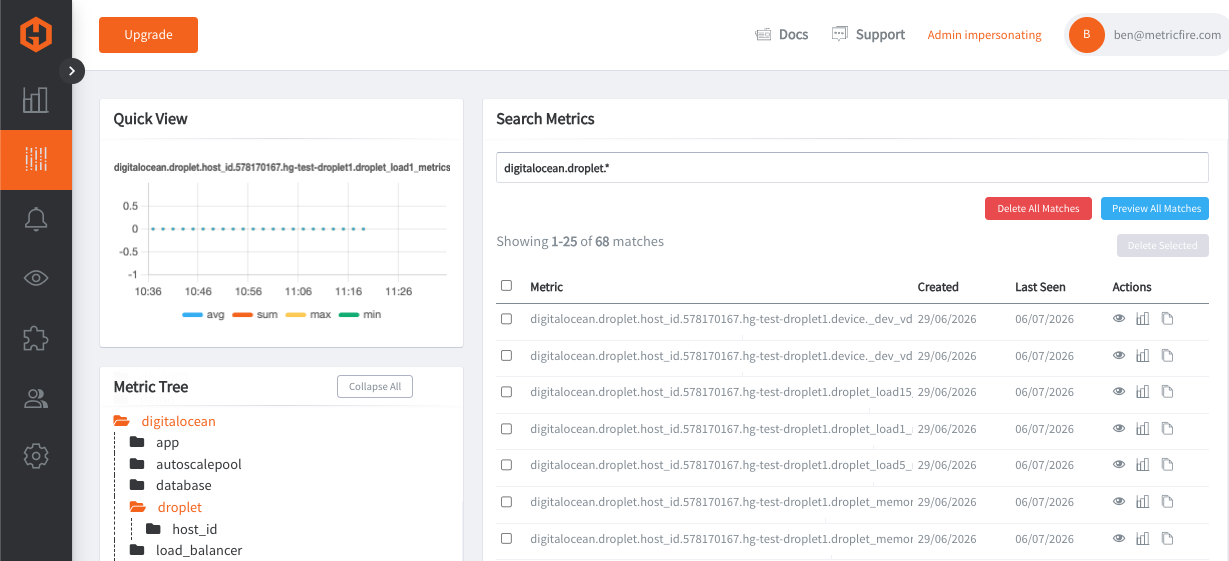
These metrics provide a useful cross-section of application, compute, database, load balancing, and scaling behavior.
Generating the DigitalOcean Overview Dashboard
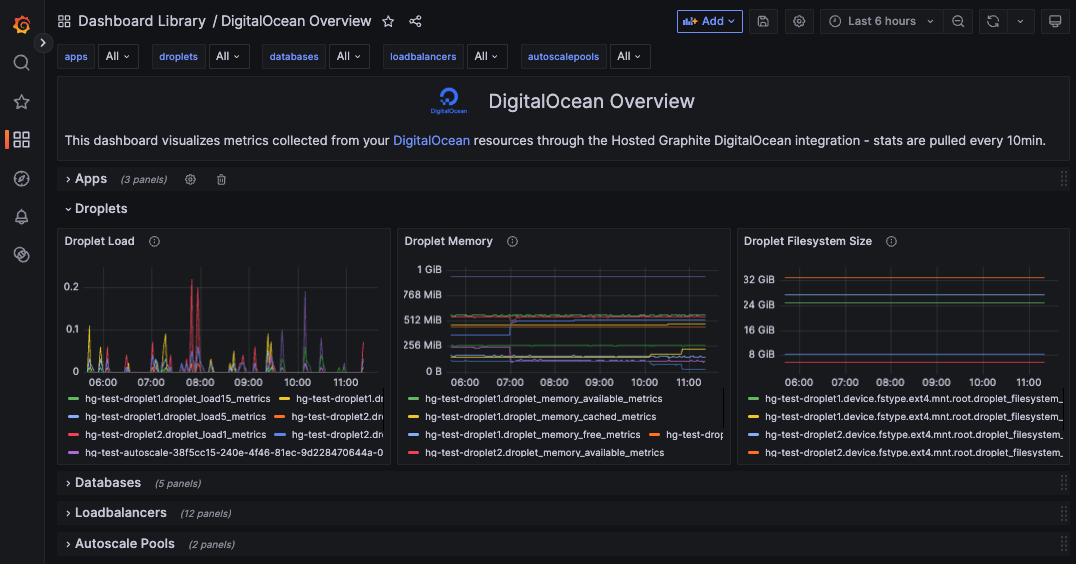
After metrics are flowing into Hosted Graphite, the next step is to generate the DigitalOcean Overview dashboard from the Hosted Graphite dashboard library.
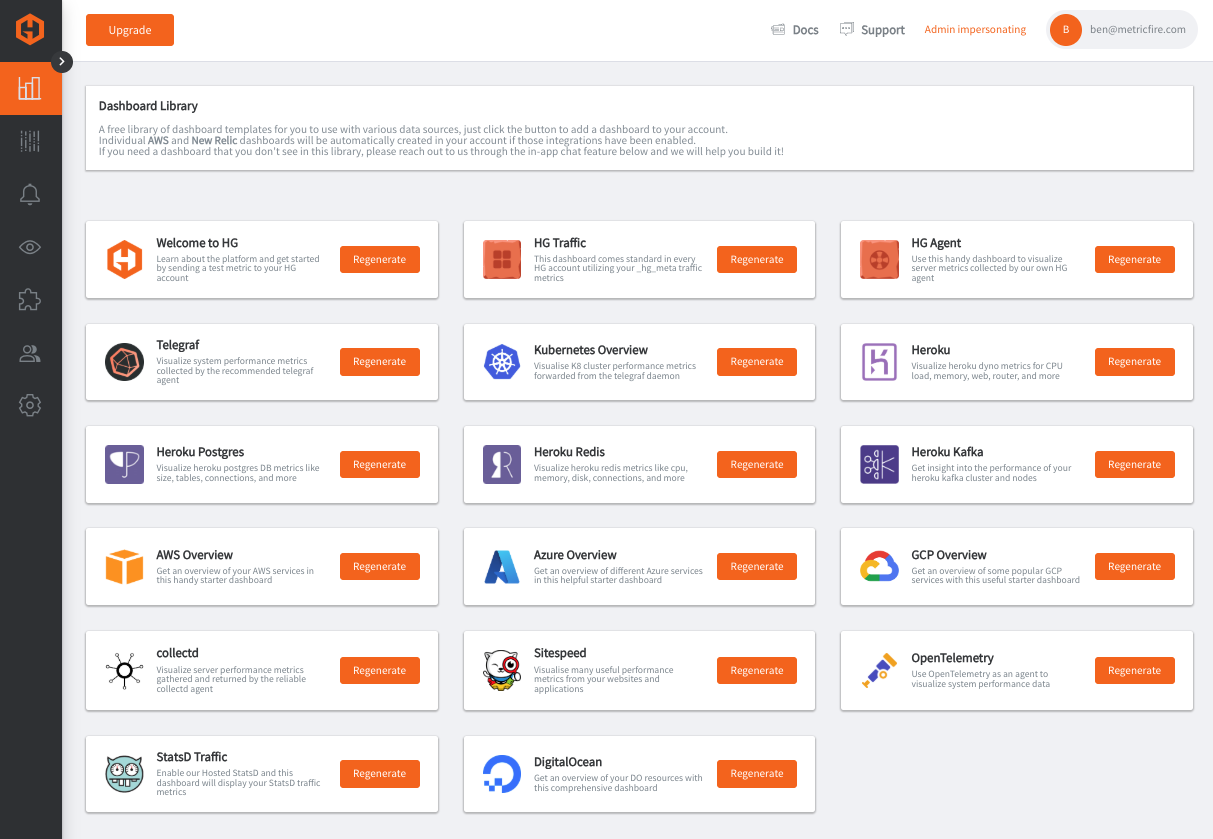
This dashboard is designed to provide a practical starting point rather than an exhaustive list of every available metric. The goal is to help users quickly answer questions like:
- Are my applications using too much CPU or memory?
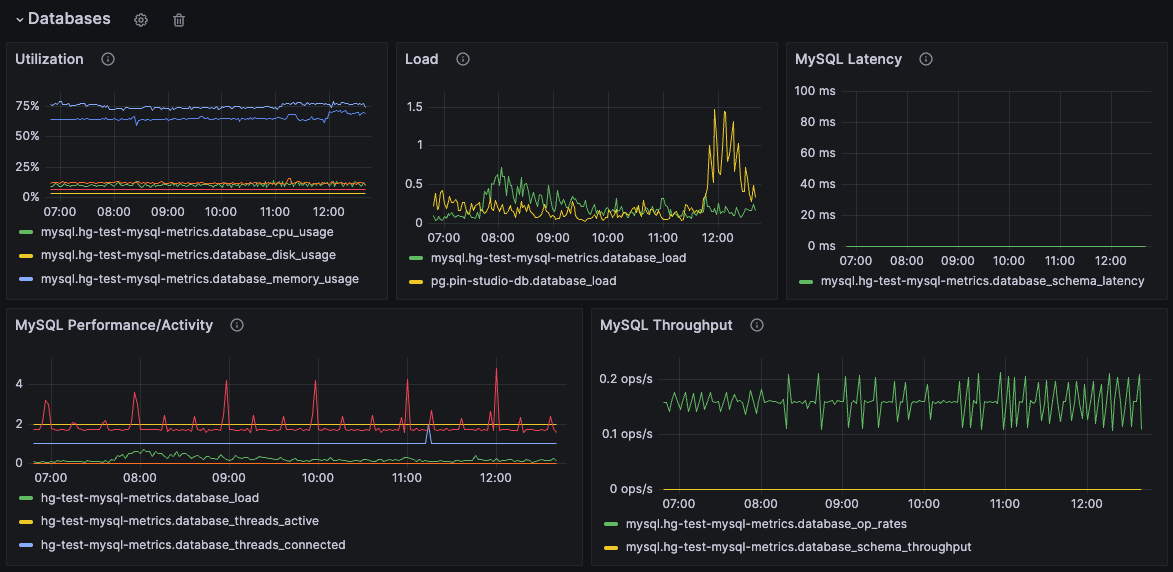
- Are my databases healthy?
- Are my Droplets under load?
- Is my Load Balancer routing traffic successfully?
- Are backend targets healthy?
- Is my Autoscale Pool behaving as expected?
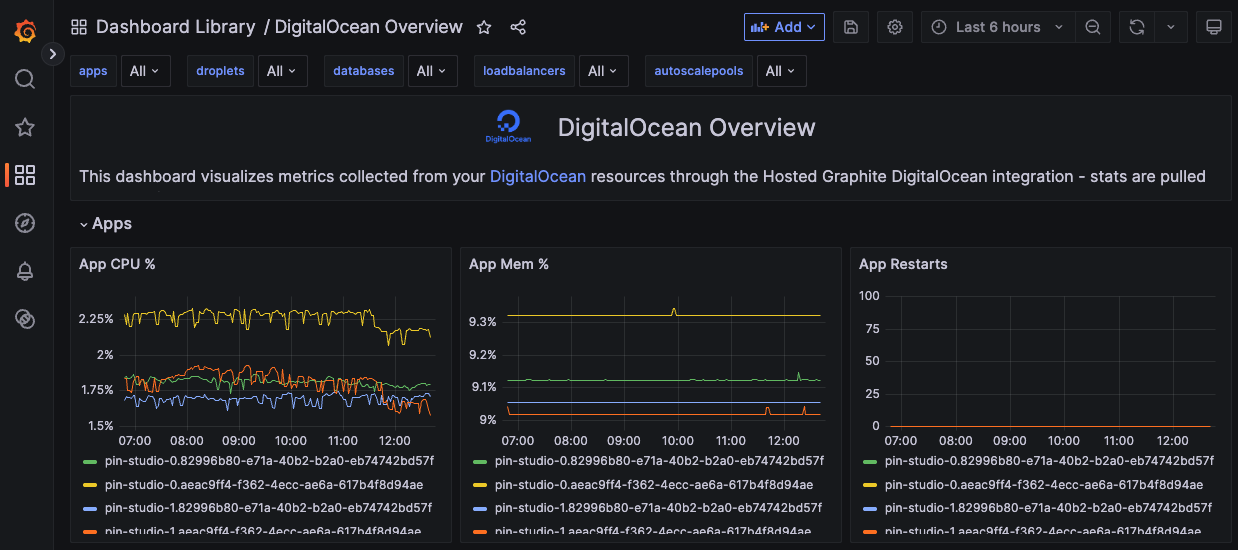
Some of the most useful dashboard panels include:
App CPU and Memory
These panels show resource usage for App Platform components. They are useful for spotting resource pressure, sudden changes after deploys, or components that may need additional capacity.
Database Utilization
The database panels show CPU usage, memory usage, disk usage, and load. These metrics are especially useful because database pressure often has a direct impact on application performance.
Droplet Load and Memory
Droplet panels show load average and memory-related metrics. Load average is useful for identifying CPU contention, while memory panels help show whether the server has enough available memory for the workload.
Autoscale Pool Utilization
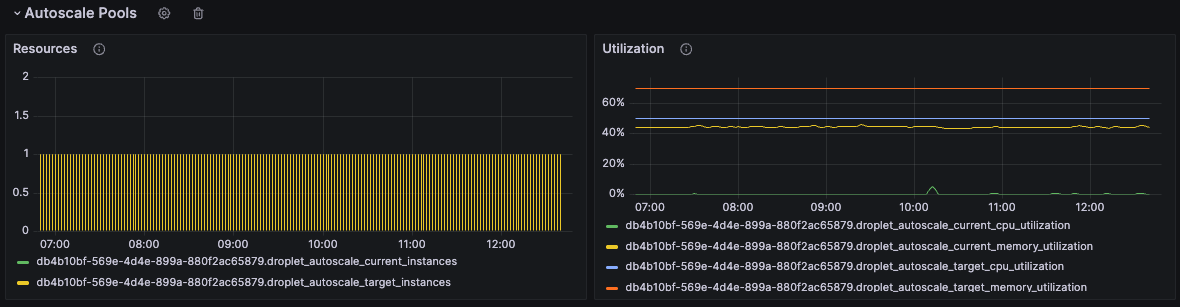
Autoscale panels show current and target instance counts, along with CPU and memory utilization. These panels help verify whether scaling behavior matches demand.
Load Balancer Metrics
Frontend Load Balancer panels show CPU utilization, active connections, request rate, response code rates, and network throughput. These panels help you understand incoming traffic and user-facing behavior.
Backend panels show queue size, backend connections, response times, session duration, downtime, and health checks. These metrics are useful for diagnosing backend availability and performance issues.
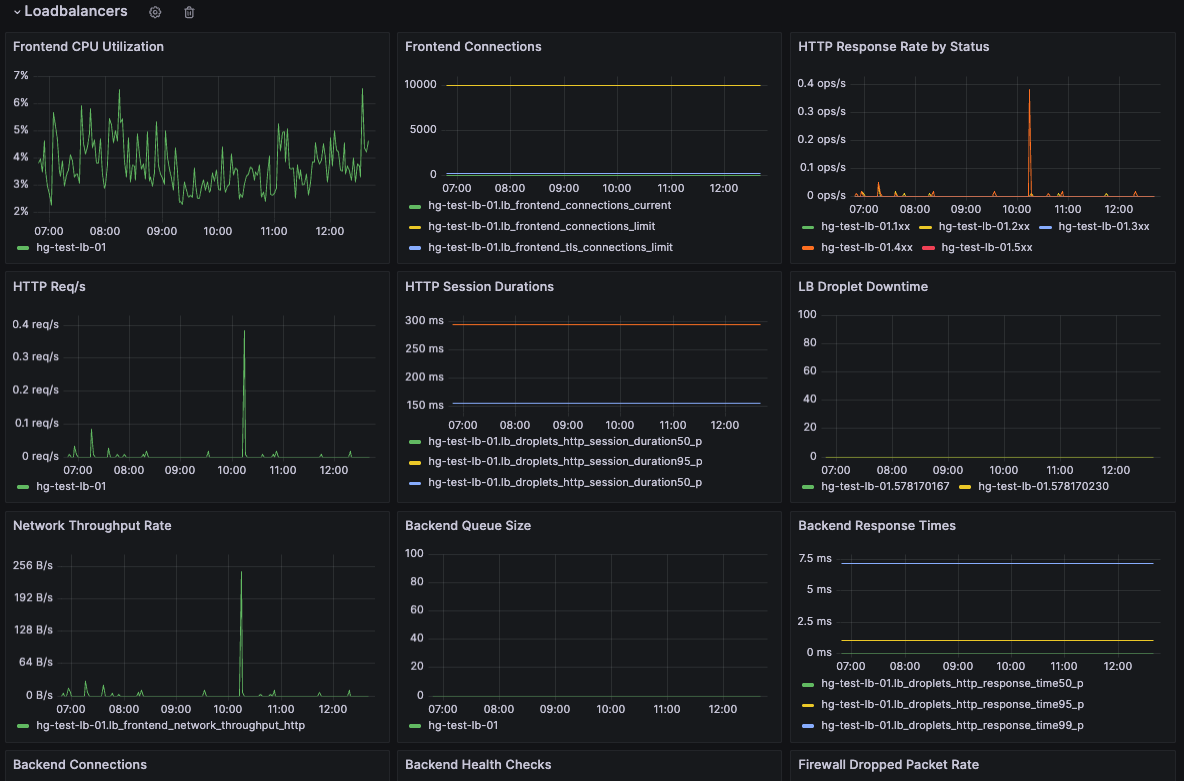
For example, if request rate increases and backend response time rises at the same time, that may indicate application saturation. If backend health checks fail, the Load Balancer may stop routing traffic to an unhealthy Droplet. If queue size grows, traffic may be arriving faster than backends can process it.
Creating a Composite Alert for DO Service Health
Dashboards are useful for investigation, but alerts are what help teams respond quickly when something changes.
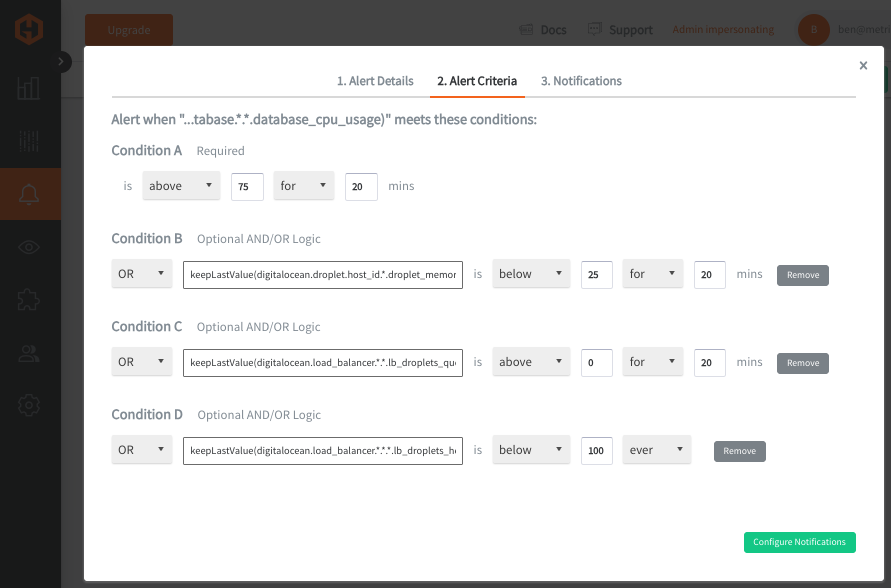
For this example, we can create a single composite alert that checks several DigitalOcean resource types at once. Instead of creating separate alerts for every individual metric, a composite alert lets us combine multiple conditions into one service-level health check. A practical alert might be called:
DigitalOcean Service HealthThe goal of this alert is to notify us if any major part of the DigitalOcean environment appears unhealthy.
Example conditions:
Condition A: Database CPU is high
digitalocean.database.*.db.*.database_cpu_usageTrigger when any matching database CPU metric is above 75% for 20 minutes. This catches sustained pressure on MySQL or PostgreSQL.
Condition B: Droplet memory is low
digitalocean.droplet.host_id.*.*.droplet_memory_available_metricsTrigger when available memory falls below an expected threshold for 20 minutes. This catches Droplets that may be approaching memory exhaustion.
Condition C: Load Balancer backend queue is growing
digitalocean.load_balancer.*.*.lb_droplets_queue_sizeTrigger when queue size rises above a safe threshold (0). This catches cases where requests are backing up before they reach backend Droplets.
Condition D: Load Balancer backend health checks fail
digitalocean.load_balancer.*.*.node.*.lb_droplets_health_checksTrigger when a backend health check reports an unhealthy target (< 100). This catches backend availability issues from the Load Balancer perspective.
AND/OR Conditional Logic
The composite logic can use OR conditions:
A OR B OR C OR D OR EThis means the alert triggers if any major part of the DigitalOcean environment appears unhealthy.
For a broader health check, OR logic is usually the right choice. It answers the question:
Is anything important currently wrong?
For more specific alerts, AND logic can reduce noise. For example, a Load Balancer performance alert could trigger only when backend response time is high and queue size is growing. That is more specific than alerting on either condition alone.
A useful composite alert strategy is to start with a broad service-level alert, then add more focused alerts for specific failure modes as you learn more about your traffic patterns.
Conclusion
DigitalOcean provides useful resource-level metrics, but most production environments need a centralized place to correlate those metrics across applications, databases, servers, load balancers, and scaling infrastructure.
With the Hosted Graphite DigitalOcean integration, teams can automatically collect DigitalOcean metrics, visualize them in Grafana, and configure meaningful alerts around the resources that matter most.
In this walkthrough, we monitored an example DigitalOcean environment with an App Platform app, Managed MySQL and PostgreSQL databases, two Droplets, an Autoscale Pool, and a Load Balancer. We configured the Hosted Graphite integration, reviewed the metrics collected, generated an overview dashboard, and created a composite alert for service-level health.
This setup gives teams a well-rounded monitoring foundation for DigitalOcean infrastructure. Instead of jumping between individual resource pages, you can view your environment from one dashboard, correlate related metrics, and receive alerts when important conditions change.
Sign up for a free trial to start monitoring your DigitalOcean metrics in Hosted Graphite, or book a demo with our team.