
Table of Contents
Great systems are not just built. They are monitored.
MetricFire runs Graphite and Grafana as a fully managed service for small engineering teams, taking care of storage, scaling, and version updates so your team doesn't have to. Plans start at $19/month, billed per metric namespace rather than per host, and include engineer-staffed support. Integrations work natively with Heroku, AWS, Azure, and GCP, and data is stored with 3× redundancy in SOC2- and ISO:27001-certified data centres.
Introduction
Kubernetes is often used to process and route large volumes of data, including telemetry from IoT devices. In utility and industrial environments, this can include metrics from smart meters, sensors, and edge systems that need to be ingested, processed, and monitored in real time. The challenge is not just handling the volume of data, it's making sure that traffic is distributed efficiently across services so that no single component becomes a bottleneck.
Kubernetes provides basic load balancing and scaling out of the box, but IoT workloads introduce additional complexity. Traffic can be uneven, bursty, and geographically distributed meaning that teams often need to combine Kubernetes features with other tools to get reliable performance.
This article looks at practical ways to handle IoT metrics in Kubernetes and covers service configuration, autoscaling, routing approaches, and details around how monitoring tools like MetricFire fit into the workflow.
Setting Up Kubernetes for IoT Metrics Load Balancing
Prerequisites for Kubernetes Configuration
- To test load balancing for IoT metrics, you need a working Kubernetes cluster. This can be a managed service such as EKS, GKE, or AKS, or a Minikube setup for local development.
- A Metrics Server is required if you plan to use autoscaling. It allows Kubernetes to track resource usage such as CPU and memory, which the Horizontal Pod Autoscaler relies on.
- If you want to simulate IoT traffic, you can use tools such as Mosquitto or simple load testing scripts to generate message streams. This helps validate how your system behaves under real conditions.
- For monitoring, you can connect your cluster to a metrics platform such as MetricFire, Prometheus, or another time series backend to store and visualize data.
Deploying Kubernetes Services for IoT Metrics
Kubernetes services control how traffic is routed to your applications. In IoT pipelines, they are typically used to expose ingestion or processing endpoints that receive data from devices or upstream systems. K8 provides several service types for this. ClusterIP is used for internal communication between services within the cluster. NodePort exposes a service on each node’s IP address, which can be useful for testing or simple external access. LoadBalancer is the most common option in cloud environments, as it provisions an external endpoint and distributes incoming traffic across pods.
Example configuration:
apiVersion: v1
kind: Service
metadata:
  name: iot-metrics-service
spec:
  selector:
    app: iot-processor
  ports:
    - protocol: TCP
      port: 80
      targetPort: 9376
  type: LoadBalancer
In some cases, you may want to preserve the source IP of incoming devices. This can be done with externalTrafficPolicy set to Local. This is useful for logging or routing decisions, but it can lead to uneven traffic distribution if pods are not evenly spread. To monitor and analyze your IoT metrics, consider signing up for a free trial of Hosted Graphite or scheduling a demo with MetricFire. This integration makes it easier to track and visualize your metrics effectively.
Implementing Autoscaling for IoT Metrics Pods
IoT traffic is often uneven, with devices sending bursts of data during events or at scheduled intervals. Autoscaling helps Kubernetes handle these fluctuations without manual intervention. The Horizontal Pod Autoscaler adjusts the number of pods based on observed metrics, typically using CPU and memory by default. However, IoT workloads often scale more effectively when using custom metrics such as message rate or queue depth. To support this, your application needs to expose meaningful metrics, those metrics need to be collected by a system such as Prometheus, and a metrics adapter is required to make them available to Kubernetes for scaling decisions.
Example HPA configuration:
apiVersion: autoscaling/v2
kind: HorizontalPodAutoscaler
metadata:
  name: iot-metrics-hpa
spec:
  scaleTargetRef:
    apiVersion: apps/v1
    kind: Deployment
    name: iot-processor
  minReplicas: 2
  maxReplicas: 10
  metrics:
  - type: Pods
    pods:
      metric:
        name: iot_messages_per_second
      target:
        type: AverageValue
        averageValue: 1
Using a metric like messages per second gives a more accurate signal than CPU usage alone. This helps the system scale in a way that matches real workload demand.
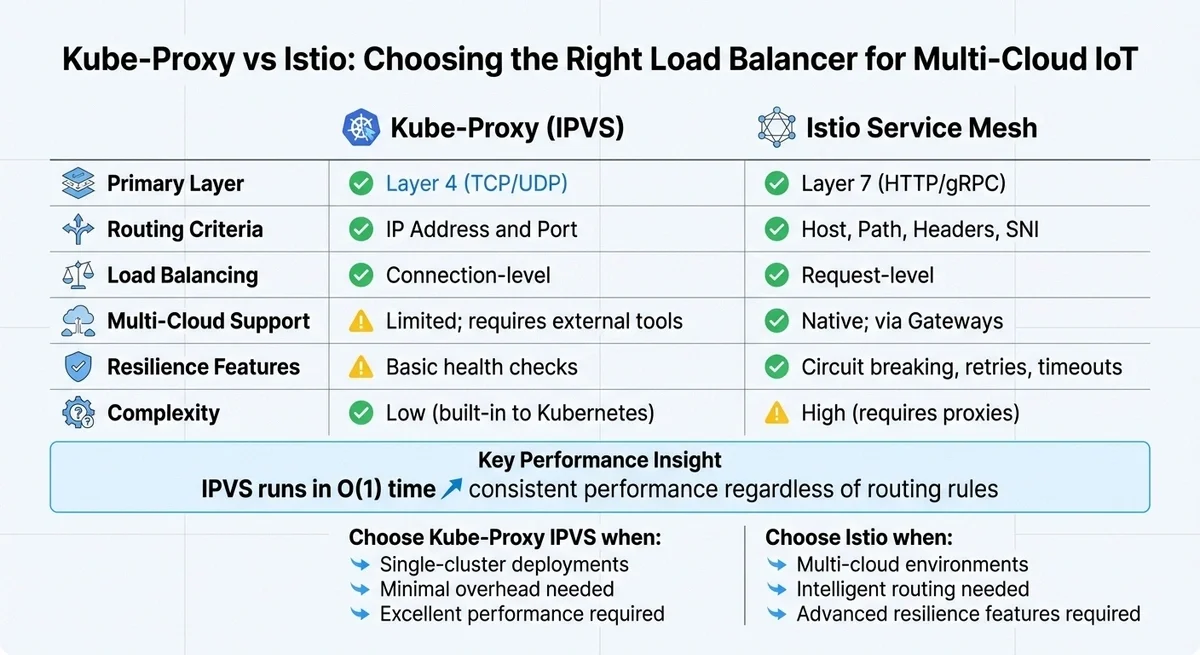
Kube-proxy vs Istio for IoT Traffic
Kubernetes includes a built in component called kube-proxy that handles basic load balancing. It works at the network level and distributes traffic across available pods. For many use cases, this is enough because switching kube-proxy to IPVS mode can improve performance in larger clusters by handling routing more efficiently. However, kube-proxy operates at a lower level and does not have awareness of application level behavior. This can be limiting when dealing with long lived connections or uneven traffic patterns.
Using Istio for Load Balancing
Istio adds a service mesh layer on top of Kubernetes and allows more advanced routing based on request characteristics and provides features such as retries, timeouts, and traffic shaping. This can be useful in more complex environments, especially when services are spread across multiple clusters or regions. The tradeoff is additional complexity and operational overhead.
Efficient load balancing is critical to ensuring IoT metrics are delivered on time, especially in multi-cloud environments. After implementing autoscaling, the next hurdle is routing these metrics seamlessly across various cloud providers. While Kubernetes' default load balancing works well within a single cluster, multi-cloud environments demand more sophisticated strategies. Let’s explore how kube-proxy and Istio handle this challenge.
Using Kube-Proxy for Load Balancing
Kube-proxy serves as Kubernetes' built-in load balancer, operating at Layer 4 to manage TCP and UDP traffic based on IP addresses and ports. For large IoT deployments managing thousands of data streams, switching kube-proxy from its default iptables mode to IPVS (IP Virtual Server) mode can significantly boost performance. Unlike iptables, which processes rules one by one, IPVS uses hash tables for near-instant operations, ensuring consistent performance even as the number of services grows.
"The advantage of IPVS over iptables is scalability: no matter how many routing rules are required... IPVS runs in O time." - Kay James
To enable IPVS mode, simply configure kube-proxy with the --proxy-mode=ipvs flag and ensure the necessary kernel modules are loaded. However, kube-proxy is primarily suited for connection-level load balancing within a single cluster. For protocols like gRPC or HTTP/2, which rely on long-lived connections, this can lead to "hot" pods - where some instances handle much more traffic than others. While IPVS enhances internal routing, it lacks the advanced capabilities needed for multi-cloud setups.
Monitoring Kubernetes and IoT Metrics with MetricFire
In a Kubernetes-based IoT pipeline, there are two different types of metrics you need to track. Both are important, and they serve different purposes.
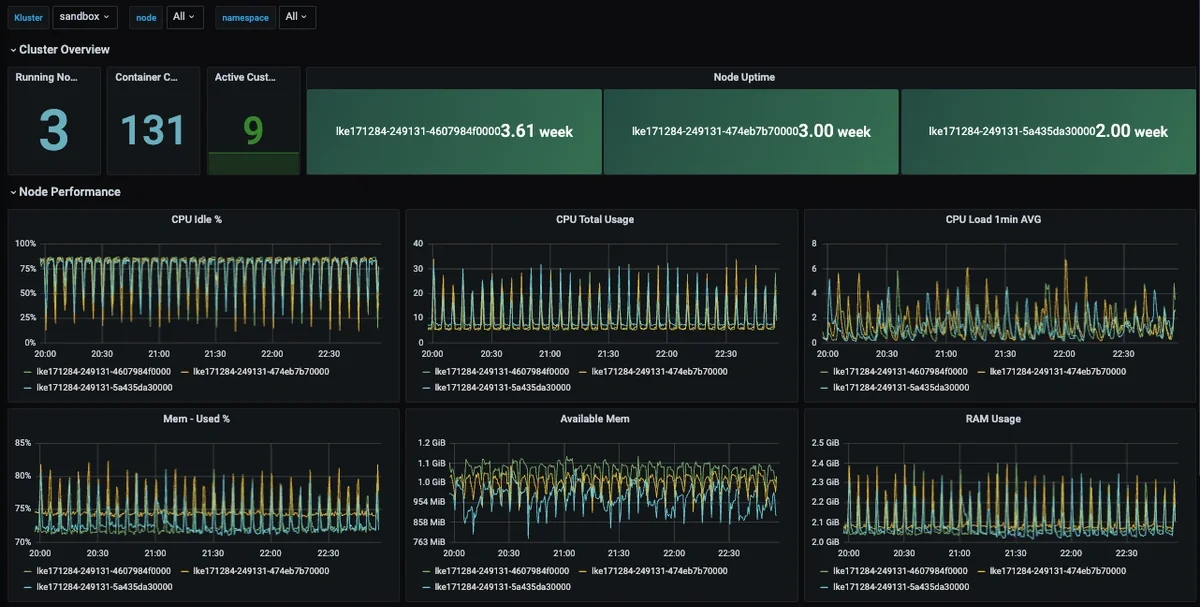
- The first is Kubernetes infrastructure metrics, which include node resource usage, pod performance, restarts, and network activity. They help you understand whether your cluster can handle incoming traffic and whether load is being distributed evenly.
- The second is IoT application metrics and these come from the services processing device data. They include message throughput, ingest latency, queue depth, and error rates. These metrics show how well your system is handling data from devices.
To get a complete view, both layers should be collected and sent to the same monitoring system.
Collecting Kubernetes Metrics with Telegraf
A practical way to monitor Kubernetes is to run Telegraf as a DaemonSet. This ensures one Telegraf agent runs on every node in the cluster. Each agent collects system and Kubernetes level metrics and forwards them to MetricFire's Hosted Graphite. This setup provides visibility into cluster health without requiring additional infrastructure:
- Telegraf runs on every node
- Collects CPU, memory, network, and pod metrics
- Sends data to Hosted Graphite for storage and visualization
Collecting IoT Metrics with MQTT and Telegraf
In most IoT systems, data does not arrive as metrics by default. Devices first send telemetry through a message broker such as Mosquitto using MQTT. The broker acts as a transport layer. It receives messages from devices and distributes them to consumers, but it does not create metrics on its own. To turn this message flow into usable metrics, you need a consumer layer. Telegraf includes an MQTT Consumer input plugin that can subscribe to MQTT topics and convert incoming messages into time series metrics. In this setup:
- Devices or gateways publish telemetry to MQTT topics
- The MQTT broker receives and distributes those messages
- Telegraf subscribes to the relevant topics
- Messages are parsed into metrics and forwarded to MetricFire
This allows you to track workload-specific signals such as:
- Messages per second
- Processing latency
- Error rates
- Device or topic level activity
Putting It Together
Both approaches run at the same time and feed into the same monitoring backend.
- Telegraf DaemonSet monitors Kubernetes infrastructure
- Telegraf MQTT Consumer captures IoT data streams
- Both send metrics to your storage backend
This creates a unified view where you can correlate system behavior with application activity. For example, you can see a spike in incoming device traffic, increased CPU usage on ingestion pods, and rising latency all in the same dashboard. This combined visibility is what makes load balancing effective. It allows you to understand whether performance issues are caused by uneven traffic, insufficient scaling, or problems in the processing pipeline.
By monitoring both infrastructure and IoT metrics together, teams can make better decisions about scaling, routing, and resource allocation in Kubernetes.
Testing and Optimizing IoT Metrics Load Balancing
Once your Kubernetes services and autoscaling are configured, the next step is validating how the system behaves under real IoT traffic patterns. IoT workloads are rarely steady because devices often send data in bursts, either on schedules or in response to events. So testing should reflect this behavior.
Load Testing IoT Workloads
Instead of relying on generic HTTP testing, it is better to simulate how your pipeline actually receives IoT data. This can include publishing messages to MQTT topics at increasing rates, sending batched HTTP or gRPC requests to ingestion endpoints, or replaying recorded traffic from real devices. The goal is to understand how traffic is distributed across pods and how quickly the system responds to changes in load. During testing, focus on key signals such as request rate per pod, ingestion or processing latency, error rates, and how the system scales as demand increases.
You can watch autoscaling in real time with:
kubectl get hpa --watch
This helps confirm that scaling is responding to load rather than lagging behind it. A simple but effective test is to temporarily scale a deployment down and confirm that traffic is redistributed correctly and alerts are triggered as expected.
Optimizing Resource Utilization
After testing, you can tune your system based on what you observe. For IoT workloads, scaling based on CPU alone is usually not enough, since it doesn't always reflect actual demand. Metrics such as message rate or queue depth usually provide a more accurate signal. In practice, this means setting realistic resource requests and limits for each container, using custom metrics for autoscaling where possible, and adjusting stabilization windows if scaling reacts too quickly to short spikes. It is also important to configure readiness probes so traffic is only routed to healthy pods. For larger deployments, Kubernetes EndpointSlice can help improve how traffic is distributed across many pods. The goal is to ensure that scaling and load balancing reflect real workload demand rather than just raw resource usage.
Conclusion
Kubernetes offers powerful tools to scale IoT metrics effectively across multi-cloud setups. One standout feature, Topology Aware Routing, reduces latency and cross-zone data costs by ensuring traffic stays within the originating node or zone. This aligns with findings from academic research:
"As computation shifts from the cloud to the edge to reduce processing latency and network traffic, the resulting Computing Continuum creates a dynamic environment where meeting strict Quality of Service requirements... becomes challenging." - Ivan Cilic et al., IEEE Graduate Student Member
Kubernetes can handle IoT metrics pipelines effectively, but only when it is paired with a clear monitoring and scaling strategy. In practice, this means Kubernetes manages scheduling, scaling, and service routing, your applications handle the ingestion and processing of IoT data, and your monitoring system provides visibility into both system health and workload behavior. Load balancing only becomes meaningful when you can see what is happening across these layers. Infrastructure metrics show whether the cluster is under pressure, while IoT metrics show whether data is being processed correctly.
By combining K8s services and autoscaling with monitoring from tools like MetricFire, teams can build systems that respond to real traffic patterns instead of relying on assumptions. Most deployments do not need complex routing or multi cloud setups at the start. A simple, well-instrumented system with clear metrics and stable scaling behavior is usually enough to achieve reliable performance, with more advanced strategies added over time as requirements grow.
FAQs
1: When does Kubernetes make sense for IoT metrics pipelines?
Kubernetes is useful when you are running services that ingest, process, or route IoT data at scale. This includes message brokers, stream processors, and APIs. It is not typically used to manage devices directly. Instead, it sits behind the ingestion layer and handles the services that process incoming data.
Source:
https://kubernetes.io/docs/concepts/overview/what-is-kubernetes/
2: What metrics should I use for autoscaling IoT workloads?
CPU and memory are a starting point, but they do not always reflect real demand. For IoT systems, better signals often include:
- Messages per second
- Queue depth
- Processing latency
These metrics align more closely with how much work your system is actually doing.
Source:
https://kubernetes.io/docs/tasks/run-application/horizontal-pod-autoscale/
3: How do I monitor both Kubernetes and IoT metrics together?
You need to collect metrics from two layers. Kubernetes metrics can be collected using a Telegraf DaemonSet, which runs on each node and captures system level data. IoT metrics can be collected from your ingestion pipeline, for example by using Telegraf’s MQTT Consumer plugin to subscribe to device data streams. Both sets of metrics can then be sent to a storage backend like MetricFire for unified dashboards and alerting.
Sources:
https://github.com/metricfire/telegraf-daemonset
https://github.com/influxdata/telegraf/tree/master/plugins/inputs/mqtt_consumer
4: When should I use Istio instead of built in Kubernetes load balancing?
Kubernetes built in load balancing works well for most use cases, especially within a single cluster. Istio becomes useful when you need more control over traffic behavior. This includes routing based on request details, handling retries, or managing traffic across multiple clusters. It adds flexibility, but also increases complexity, so it is usually introduced later as systems grow.
Source:
https://istio.io/latest/docs/concepts/what-is-istio/
5: How can I prevent high cardinality issues in IoT metrics?
IoT data often includes identifiers such as device IDs, locations, or session values. If these are used directly as labels, they can create too many unique time series. To avoid this:
- Limit labels to stable dimensions such as region or device type
- Avoid using raw IDs as labels
- Aggregate data where possible before sending
This helps keep your monitoring system efficient and easier to query.
Source:
https://prometheus.io/docs/practices/naming/
Sign up for the free trial and begin monitoring your infrastructure today. You can also book a demo to speak with the MetricFire team directly about your monitoring needs.

