
Table of Contents
Great systems are not just built. They are monitored.
MetricFire runs Graphite and Grafana as a fully managed service for small engineering teams, taking care of storage, scaling, and version updates so your team doesn't have to. Plans start at $19/month, billed per metric namespace rather than per host, and include engineer-staffed support. Integrations work natively with Heroku, AWS, Azure, and GCP, and data is stored with 3× redundancy in SOC2- and ISO:27001-certified data centres.
Custom Metrics with Hosted Graphite: Quick Start
Want to monitor app performance in real-time? MetricFire’s Hosted Graphite makes it simple to track custom metrics such as API response times, user activity, and transaction volumes. Here's what you need to know:
- Send metrics via TCP, UDP, or HTTP POST and visualize them in Grafana dashboards within minutes.
- Store data securely with 3x redundancy and retention options from 5-second intervals (1 day) to 1-hour intervals (2 years).
- Flexible pricing starts at $19/month, based on the number of unique metric namespaces (not data volume).
-
Use tools like
curlornetcatto send your first metric using a straightforward format:metric.name value [timestamp]. - Automate alerts with integrations like Slack or PagerDuty and set them up directly from dashboards.
Start monitoring in no time: Sign up for a 14-day free trial (no credit card required) or book a demo to explore your needs.
Sending Metrics - MetricFire Tutorial
Prerequisites for Setting Up Hosted Graphite
To start sending custom metrics, you'll need a MetricFire account and a few basic tools. The process is straightforward and can be completed in just a few minutes. Here's what you need to know.
MetricFire Account and Plan Details
First, sign up for a MetricFire account to access the Hosted Graphite dashboard, carbon endpoints, and storage backend. MetricFire offers a 14-day free trial, which includes 500 to 750 metrics, 5 user seats, and access to all integrations - no credit card required. This trial gives you ample opportunity to test your custom metrics before deciding on a paid plan.
When you're ready to commit, the Intro Plan starts at $19/month. This plan includes 250 metrics with 6-month retention, 2 users, and 10 alerts. Pricing is based on the total number of unique metric namespaces stored in your account, not the volume of data points sent. Whether you're tracking host metrics, custom application metrics, or tagged metrics, the pricing model is simple: "1 metric is 1 metric".
If you exceed your metric limit, data points will be dropped. However, MetricFire provides automated dashboards and alerts to notify you when you're nearing the limit. The platform is designed for reliability, offering 99.95% uptime and storing three redundant copies of all data at every aggregation resolution.
Once your account is set up, the next step is to verify connectivity using the tools below.
Tools and API Access
To test connectivity and send your first metrics, you'll need some basic tools. Most Unix-based systems come with curl pre-installed, and it's also available for Windows. For socket-based testing, netcat (nc) allows you to send metrics via TCP or UDP connections to port 2003.
Your API Key is crucial - it’s required for data ingestion and authentication. After logging into your MetricFire account, you’ll find your API Key on the main dashboard page. Use this key as a prefix for TCP/UDP transmissions (e.g., YOUR-API-KEY.metric.name) or as the Basic Authentication username for HTTP POST requests.
Here’s a quick test to verify connectivity using curl:
curl https://YOUR-API-KEY@www.hostedgraphite.com/api/v1/sink --data-binary "test.metric.name 1.2".
If everything is set up correctly, your metric should appear in the dashboard within about 60 seconds. For socket-based testing, try this command:
echo "YOUR-API-KEY.test.metric 1.2" | nc carbon.hostedgraphite.com 2003.
| Tool | Purpose | Protocol/Port |
|---|---|---|
| curl | HTTP POST ingestion | HTTPS (Port 443) |
| netcat (nc) | Simple network connections | TCP/UDP (Port 2003) |
| ncat / openssl | Encrypted tunnels | TCP over TLS (Port 20030) |
With your account set up and these tools ready, you're all set to send your first custom metric to Hosted Graphite. If you need additional guidance, you can always book a demo to discuss your monitoring requirements with the MetricFire team.
Sending Your First Custom Metric
How to Send Custom Metrics to Hosted Graphite in 4 Steps
Now that your account is ready, let’s walk through how to send your first metric to Hosted Graphite. Follow these steps to get started.
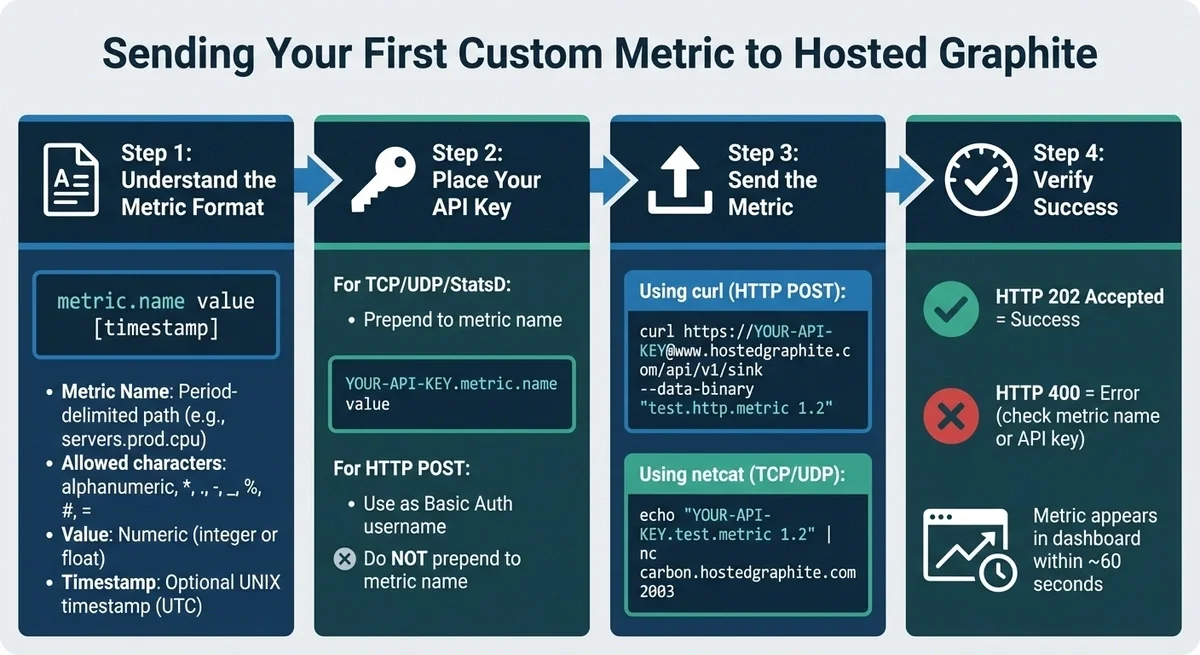
Understanding the Metric Format
Before sending any data, it’s crucial to adhere to the required format to ensure metrics are processed correctly.
Each metric you send to Hosted Graphite follows this structure:
metric.name value [timestamp]
-
Metric Name: This is a period-delimited path, such as
servers.prod.cpuorapp.checkout.response_time. It can only include alphanumeric characters and the symbols*,.,-,_,%,#, and=. Using unsupported characters will block the metric from being ingested. You can find details about such errors in the "Invalid Metrics" graph within your Account Diagnostics UI. -
Value: This must be a numeric value - either an integer like
59or a floating-point number like1.2. Strings or boolean values won’t work. - Timestamp (optional): A UNIX timestamp in UTC (seconds since January 1, 1970). If you don’t provide a timestamp, Hosted Graphite will assign the current time when the metric is received.
API Key Placement
Where you place your API key depends on the protocol you’re using:
-
For TCP, UDP, and StatsD connections: Add your API key at the start of the metric name. Example:
YOUR-API-KEY.metric.name value - For HTTP POST requests: Use your API key as the username for Basic Authentication. Do not prepend it to the metric name.
Using HTTP POST with curl
To quickly test your setup, you can use a simple curl command. Here’s an example:
curl https://YOUR-API-KEY@www.hostedgraphite.com/api/v1/sink --data-binary "test.http.metric 1.2"
Replace YOUR-API-KEY with the key found on your dashboard. The --data-binary flag ensures the metric string is sent exactly as written. If the request is successful, you’ll get an HTTP 202 Accepted response with no body. A 400 error means there’s an issue with either the metric name or the API key.
For production environments, consider sending metrics asynchronously or batching multiple lines to improve efficiency.
Want to give it a try? Sign up for a free trial to start monitoring your infrastructure with a Graphite monitoring tool today, or book a demo to explore how MetricFire can meet your monitoring needs.
Visualizing Metrics with Grafana Dashboards
When your metrics start streaming into Hosted Graphite, Grafana dashboards are automatically set up to display them. This means you can begin visualizing your custom metrics in just a few minutes. These visualizations not only confirm that your metrics are being ingested correctly but also provide real-time insights into your infrastructure.
Here’s how you can access and make the most of these dashboards.
Accessing Hosted Graphite Dashboards
To get started, log in to your MetricFire account and head over to the Dashboards section in the main menu. You’ll notice a default "Welcome to HG" dashboard, which displays your initial metrics.
Before diving into custom dashboards, use the Metrics Search UI to locate the exact naming path of your stored metrics. This step is crucial for saving time when building queries. For instance, if you previously sent the metric test.http.metricYou’ll find its full path listed here.
Creating Custom Graphs
Once you’re familiar with your metrics, you can start building dashboards tailored to your needs.
- Go to Dashboards → + Add New Dashboard, then click Add Panel. Make sure the Hosted Graphite data source is selected.
-
In the query field, input your metric name (e.g.,
test.http.metric) or use wildcards to pull related metrics. For example, enteringservers.*.cpuwill display CPU metrics for all your servers at once. -
Use Graphite functions like
summarize(),movingAverage(), oraliasByNode()to manipulate and simplify your data. For example,aliasByNode()can shortenservers.prod.cpu.loadto justloadin your graph legend, making it much easier to read. - After setting up your dashboard, click Save and give it a name. You can also use the Share option to create a bookmarkable URL that lets team members view the dashboard without logging in.
One piece of advice: avoid using overly broad wildcards like servers.*.*.cpu if you’re monitoring a large number of servers. This can cause significant delays when loading your dashboard. Instead, focus on specific environments, such as servers.production.*.cpu, for faster performance.
Ready to see it in action? Sign up for a free trial to start monitoring your infrastructure. You can also book a demo to discuss your monitoring goals with the MetricFire team.
Advanced Configurations for Custom Metrics
Once you've set up the basics, fine-tuning Hosted Graphite ensures it can handle the demands of large-scale monitoring. This is especially important when you're dealing with hundreds of servers or thousands of metrics per minute. Let’s dive into managing metric paths and aggregates to improve query efficiency.
Managing Metric Paths and Aggregates
The structure of your metric names has a big impact on how quickly you can run queries. By using period-delimited paths (e.g., servers.prod.memory.free), you create a hierarchy that’s easy to navigate. Each period acts like a folder, making wildcard searches faster and more intuitive.
When you're juggling thousands of metrics, aggregation rules become your best friend. These rules allow you to combine multiple input metrics into a single output, reducing the load on your dashboards. For instance, instead of querying servers.*.requests.200 for every server, you can create an aggregate metric like aggregates.servers.all.requests.200 for quicker access.
"Aggregation rules allow you to effectively pre-compute the most expensive parts of some queries." - Hosted Graphite Docs
To set up aggregation rules, the <<rest>> pattern is key. This matches across multiple nodes in your metric paths. For example, servers.*.<<rest>> can group all metrics starting with servers.* into a single aggregate path, no matter how many nodes follow. These output metrics are prefixed aggregates. to differentiate them from raw data.
MetricFire's Hosted Graphite stores data at various resolutions - 5 seconds for 1 day, 30 seconds for 3 days, 300 seconds for 6 months, and 3,600 seconds for 2 years. Your billing is based on the number of unique metrics stored.
By combining thoughtful naming conventions, aggregation rules, and Graphite settings, you can significantly improve performance.
Configuring Graphite Settings
For high-frequency metrics, it's important to monitor how MetricFire's Hosted Graphite handles data ingestion. The Metrics API endpoint /api/v1/metric/busy helps you identify metrics that are being rate-limited. If you notice rate-limiting, it’s often a sign that you need to improve your path structure or implement better aggregation.
To avoid network delays affecting your application's performance data, send metrics asynchronously.
Behind the scenes, MetricFire's Hosted Graphite uses a Riak-based backend designed for high cardinality. It can handle billions of data points per second and supports millions of unique metrics. To ensure reliability, the system stores three redundant copies of data for every resolution tier.
"Our Riak database has been optimized to handle a high cardinality and is able to read, write, and traverse data quickly and efficiently." - MetricFire
Ready to take your monitoring to the next level? Start a free trial or book a demo to connect with the MetricFire team and explore how Hosted Graphite can meet your needs.
Conclusion
MetricFire makes setting up and managing custom metrics straightforward. You can send plaintext metrics, visualize your data with Grafana, and set up alerts with ease. The platform supports various protocols like TCP, UDP, HTTP POST, and StatsD and Graphite, giving you flexibility in how you monitor your systems.
With MetricFire, your data is in good hands. The service handles data aggregation, provides long-term storage for up to 2 years, and ensures reliable data redundancy and uptime. Whether you're monitoring just a few servers or managing thousands of metrics with high-cardinality data, MetricFire scales effortlessly. Plus, billing is based only on the number of unique metrics stored, keeping costs predictable.
Ready to get started? Try the platform for free with a trial account, or book a demo to discuss your specific monitoring needs with the MetricFire team.
MetricFire streamlines real-time monitoring, making it simple from start to finish.
FAQs
How do I know if my metric was ingested successfully?
To ensure your metric was successfully ingested, look for its presence and updates in your Hosted Graphite dashboard. You can also use the API to confirm receipt of data. For step-by-step instructions, check out the "Sending Metrics" and "Getting Started" sections in the documentation.
What counts as a “unique metric” for billing?
A "unique metric" for billing is a specific data point sent to Hosted Graphite. It's usually recognized by its name or tag and is individually counted as part of your usage and billing calculation.
Why are some of my metrics being dropped or rate-limited?
Metrics may be dropped or rate-limited due to Hosted Graphite's per-metric rate limiting. This system helps maintain stability by managing high-volume traffic on specific metrics, preventing backend resource overload and potential data loss.
Sign up for the free trial and begin monitoring your infrastructure today. You can also book a demo to speak with the MetricFire team directly about your monitoring needs.

