
Table of Contents
Great systems are not just built. They are monitored.
MetricFire is the fully managed Graphite and Grafana platform for small teams that don’t want to self-host their monitoring stack. Pre-built dashboards, alerts, and native add-ons for Heroku, AWS, Azure, and GCP. All with dedicated support and no infrastructure to maintain.
How Custom Webhooks Work with Grafana
Custom webhooks in Grafana let you send alerts and notifications to external APIs or services. They work by packaging alert data into a JSON payload and sending it to a specified URL whenever an alert is triggered or its state changes. Here's what you need to know:
- Types of Webhooks: Grafana supports both outgoing webhooks (for notifying external systems) and incoming webhooks (for triggering incidents in Grafana).
- Customization: You can tailor payloads using Go or Jinja2 templates to fit the requirements of your destination API.
- Security: Features like HTTP Basic Authentication, custom headers, and HMAC-SHA256 signatures ensure secure communication.
- Use Cases: Automate ticket creation (e.g., JIRA, ServiceNow), trigger workflows, or route notifications to tools like Slack or Telegram.
- Setup: Configure webhooks via the "Contact Points" tab, assign them to notification policies, and test them using the "Send Demo Alert" feature.
Custom webhooks are a flexible way to integrate Grafana with other tools, automate workflows, and streamline incident management.
Grafana webhooks for custom alerts explained with examples
Setting Up Custom Webhooks in Grafana
How to Set Up Custom Webhooks in Grafana: Step-by-Step Configuration Guide
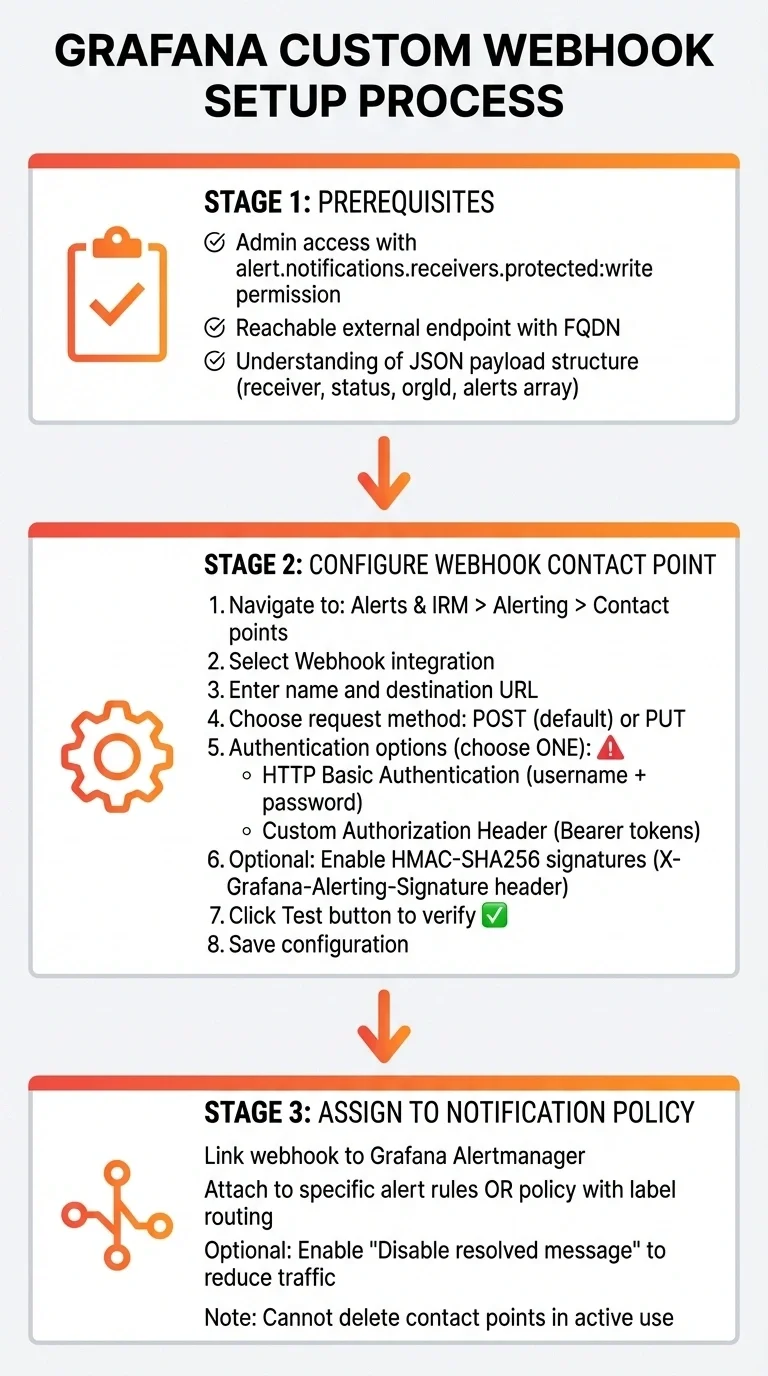
Prerequisites for Webhook Configuration
To get started with webhooks in Grafana, make sure you have the following in place:
-
Admin access to your Grafana instance, including the
alert.notifications.receivers.protected:writepermission if you're using Grafana Cloud. - A reachable external endpoint with a fully qualified domain name (FQDN).
-
A solid understanding of Graphite and Grafana integrations, specifically the JSON payload structure. The payload includes key details like the
receivername,status(firing or resolved),orgId, and analertsarray with labels, annotations, and timestamps.
Keep in mind that your endpoint must respond quickly to avoid delivery failures. Once these prerequisites are met, you're ready to set up your webhook contact point.
Configuring Webhook Contact Points
Head to the Alerts & IRM > Alerting > Contact points tab to add a new contact point. Select Webhook, then provide a descriptive name and the destination URL. By default, Grafana sends POST requests, but you can switch to PUT if needed.
For authentication, you have two options:
- HTTP Basic Authentication: Use a username and password.
- Custom Authorization Header: For example, Bearer tokens.
Note that you can only use one authentication method at a time. To enhance security, consider enabling HMAC-SHA256 signatures. This ensures Grafana signs each payload with a shared secret, adding the signature in a header (default: X-Grafana-Alerting-Signature). Before saving your configuration, use the Test button to confirm your endpoint is reachable and authentication is working.
Once everything checks out, assign your webhook to a notification policy to start receiving alerts.
Assigning Webhooks to Notification Policies
For your webhook to receive live alert data, you need to link it to a notification policy or specific alert rules. Typically, this means assigning it to the Grafana Alertmanager (the default Alertmanager). Contact points like webhooks can’t be shared across different Alertmanagers.
Go to your notification policies and either attach the webhook to specific alert rules or include it in a policy that routes alerts by labels such as severity or team. Keep in mind:
- You cannot delete a contact point that’s actively in use by a notification policy. The Contact Points tab will show how many policies reference each webhook.
- If you want to avoid notifications for resolved issues, enable the Disable resolved message option. This helps reduce unnecessary traffic to your external systems.
With these steps, your webhook integration should be up and running smoothly!
Customizing Webhook Payloads
Understanding Webhook Payload Structure
When Grafana sends webhook notifications, it uses JSON objects with a standardized format. These payloads include key fields like receiver, status, and an alerts array containing detailed information about each alert. You’ll also find fields like commonLabels (shared labels for all alerts in the group), externalURL (a link to your Grafana instance), and optional title and message fields if you’ve set them up.
Each alert within the alerts array has its own labels and annotations, such as a brief summary or description. Additionally, it includes startsAt timestamps formatted in RFC3339, a generatorURL linking to the alert rule in Grafana's UI, and a silenceURL for quickly muting the alert. Understanding this structure is essential when customizing payloads to suit your specific needs.
Using Custom Templates for Webhooks
Grafana makes it easy to tweak webhook payloads by using templates. You can adjust fields like the Title, refine the Message, or even create an entirely Custom Payload. This feature allows you to replace Grafana’s default JSON format with your personalized structure, leveraging the Go template language. Through variables like .Status, .Alerts, and .CommonLabels, you can dynamically incorporate alert data into your custom payload.
To set up a custom template, go to Alerting > Contact points > Notification Templates and define your template using {{ define "template_name" }}. Then, in your webhook contact point settings, enable Custom Payload under the "Optional settings using templates" section. Reference your template using {{ template "template_name" . }} and ensure your JSON remains valid by using the right functions.
Grafana also lets you define Payload Variables as key-value pairs within the contact point settings. These variables can be accessed in your template using .Vars.variable_name. To handle multiple alerts, use {{ range .Alerts }} to iterate through them and extract fields like annotations. Don’t forget to include generatorURL in your custom template - it’s a handy link for responders to quickly access the alert details in Grafana's UI.
Testing and Troubleshooting Webhooks
Testing Webhook Delivery
Once you've configured your webhook and customized the payload, it's crucial to test it before relying on it for important alerts. Grafana makes this easy with the "Send Demo Alert" feature in the contact point settings. This tool sends a test notification to confirm that your endpoint receives the payload correctly.
You can also manually test your endpoint using tools like curl. Send a POST request with sample JSON to your destination URL to check if the endpoint is accessible and properly handling the payload structure.
After sending a test alert, head to the "Outgoing Webhooks" tab. Here, the "Last Run" section shows the timestamp and the HTTP response code. A 200 OK response means the test was successful. You can click the status to dive into detailed request and response data for troubleshooting.
Keep in mind that your endpoint must respond within 4 seconds to avoid timeouts. If the server returns errors like HTTP 500, 502, 503, or 504, Grafana retries the delivery three times with a one-second gap between attempts.
If the webhook still doesn't work as expected, move on to the debugging steps outlined below.
Debugging Webhook Errors
When a test fails, the detailed data in the Status drawer can help pinpoint the problem. One common issue is invalid JSON formatting - this often happens when single quotes are used instead of double quotes. To fix this, apply the | tojson() filter to ensure proper JSON formatting.
Authentication errors are another frequent issue. For example, you cannot use both HTTP Basic Authentication and a custom Authorization header simultaneously. Decide on one method and stick to it. If you're using HMAC signatures, verify that the X-Grafana-Alerting-Signature header matches your shared secret and that the timestamp is current to avoid replay attacks.
If your webhook isn't triggering at all, check whether it's restricted to specific integrations. If no integrations are selected, the webhook should trigger for all sources. Webhooks created before version v1.3.11 appear as (Legacy) and cannot be edited. To make changes, create a copy of the webhook, which will convert it to the newer format.
Pay close attention to the HTTP response codes in the "Last Run" section. Client-side errors such as 400 or 404 indicate issues with your URL or request format, while server-side errors indicate problems on the server side. Remember, Grafana only retries for certain 500-level errors - other failures will require manual troubleshooting and fixes.
Conclusion
Custom webhooks expand Grafana's functionality by streamlining essential workflows. By connecting to any HTTP service, you can automate tasks like ticket creation, triggering remediation scripts, and syncing incident statuses - all without manual intervention.
The ability to customize alerts ensures precise formatting and targeted notifications. With templates, you can adjust alert content and filter unnecessary alerts, reducing notification fatigue. Plus, response referencing allows you to create multi-step workflows, such as generating a ticket with one webhook and updating it with another using the returned ticket ID.
Security and reliability are built in, thanks to HMAC-SHA256 signatures and automatic retries (up to three attempts with one-second intervals).
Key Takeaways
Here’s a quick recap:
- Configuring webhooks in Grafana is simple through Contact Points. You can customize payloads, set conditions for execution, and test alerts using the "Send Demo Alert" feature.
- The "Last Run" status drawer provides detailed insight into request and response data, enabling quick, efficient troubleshooting.
- Whether you're automating incident management, integrating with tools like Grafana Sift, or connecting legacy systems through incoming webhooks, custom webhooks simplify alerting workflows.
For MetricFire users, these webhook features further enhance Grafana's capabilities, enabling seamless real-time monitoring and incident management on the hosted platform.
FAQs
How can I securely use webhooks with Grafana?
To keep your webhooks in Grafana secure, it’s important to implement appropriate security controls and include authentication in your webhook requests. One way to do this is by using authentication headers - like API keys or tokens - to confirm the sender's identity and block unauthorized access.
Additionally, ensure your webhook endpoints are secured with HTTPS and validate all incoming requests. These precautions help protect your alerting workflows, ensuring your communications stay both reliable and secure.
What information is included in a webhook payload in Grafana?
When Grafana sends a webhook payload, it includes crucial alert details as a JSON object. This data includes the alert condition, any state changes (like switching from 'OK' to 'Alerting'), and extra metadata to give more context. These payloads are dispatched whenever an alert's status changes, making them easy to integrate into your monitoring workflows.
What should I do if my Grafana webhooks aren’t working?
If your Grafana webhooks aren’t functioning as they should, there are a few common culprits to investigate. One frequent issue is timeout errors, which occur when the webhook endpoint takes more than 30 seconds to respond. Grafana enforces a strict timeout limit, so it’s essential to ensure your endpoint processes requests quickly. To address this, you can either improve your server's performance or simplify the processing logic to meet the time constraint.
Another common problem stems from misconfigured webhook settings, such as an incorrect URL or improperly formatted payload. Double-check that the webhook URL is accurate, accessible, and formatted correctly. Additionally, ensure the payload - like the JSON body - matches the structure required by Grafana’s alert notification settings. Logs can be particularly useful for spotting issues related to network connectivity, authentication, or payload errors.
For reliable troubleshooting, always verify your settings and thoroughly test your webhook endpoint to confirm it handles requests as expected.
Sign up for the free trial and begin monitoring your infrastructure today. You can also book a demo and talk to the MetricFire team directly about your monitoring needs.

