
Table of Contents
- 10 Essential Metrics for Kubernetes Monitoring
- 1. Node CPU Usage
- 2. Node Memory Utilization
- 3. Pod Memory Usage
- 4. API Server Request Latencies
- 5. Kubelet Runtime Operations Latency
- 6. Pending Pods
- 7. Node Status Conditions
- 8. Deployment Status
- 9. Probe Count
- 10. Etcd Request Latencies
- Kubernetes Monitoring 101: A Practical Walkthrough
- How to Implement Kubernetes Monitoring
- Conclusion
- FAQs
Great systems are not just built. They are monitored.
MetricFire is the fully managed Graphite and Grafana platform for small teams that don’t want to self-host their monitoring stack. Pre-built dashboards, alerts, and native add-ons for Heroku, AWS, Azure, and GCP. All with dedicated support and no infrastructure to maintain.
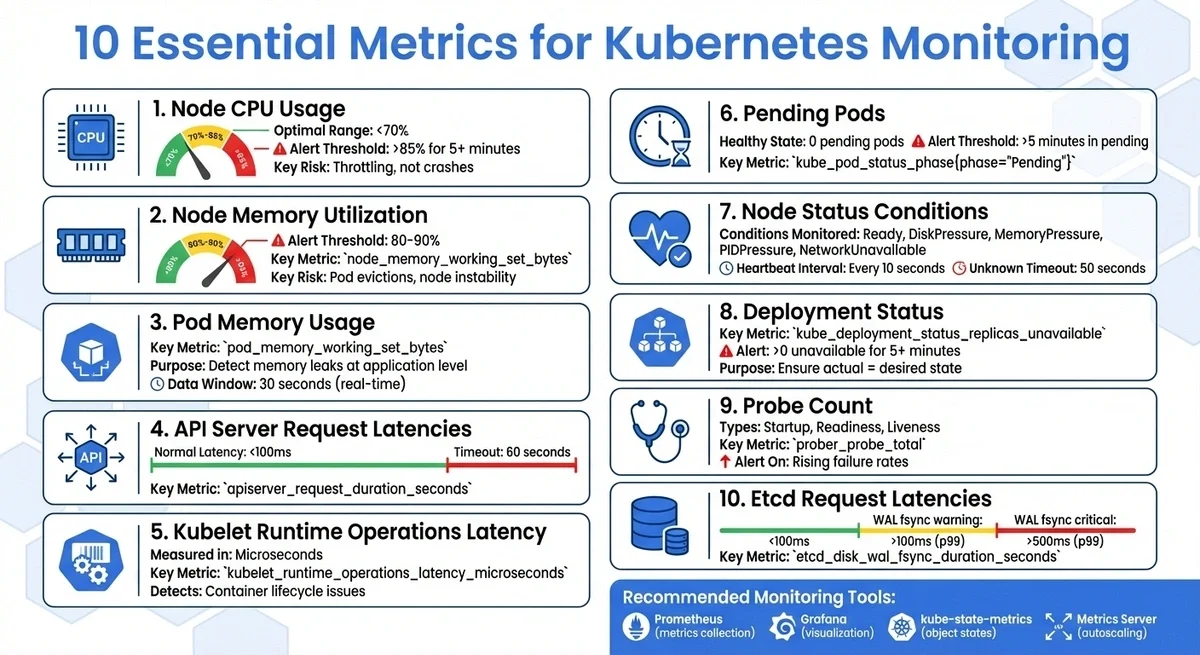
10 Essential Metrics for Kubernetes Monitoring
Monitoring Kubernetes can feel overwhelming, but focusing on the right metrics simplifies the process. Here are 10 critical metrics to track for better cluster health, performance, and troubleshooting:
- Node CPU Usage: Prevent bottlenecks and optimize resources by monitoring CPU usage at the node level.
- Node Memory Utilization: Detect memory leaks and ensure nodes aren't maxed out, avoiding instability.
- Pod Memory Usage: Identify container-specific memory issues, such as leaks, before they disrupt workloads.
- API Server Request Latencies: Monitor API server latency to ensure smooth control-plane operations.
- Kubelet Runtime Operations Latency: Monitor container lifecycle performance to avoid pod-creation delays.
- Pending Pods: Spot resource shortages or scheduling issues by monitoring unscheduled pods.
- Node Status Conditions: Ensure nodes are healthy and ready to handle workloads.
- Deployment Status: Verify deployments match desired states and troubleshoot unavailable replicas.
- Probe Count: Monitor liveness, readiness, and startup probes to maintain application health.
- Etcd Request Latencies: Monitor etcd performance, as it’s the backbone of your cluster.
These metrics help you identify issues early, optimize resources, and maintain a stable Kubernetes environment. Tools like Prometheus, Grafana, and kube-state-metrics simplify tracking and visualization, enabling proactive monitoring and faster troubleshooting.
10 Essential Kubernetes Monitoring Metrics Overview
1. Node CPU Usage
Why It Matters for Kubernetes Cluster Health
Node CPU usage is a key indicator of your Kubernetes cluster's health. It goes beyond just looking at averages. For instance, your cluster might report an average CPU usage of 60%, but one node could be running at 100%, creating a bottleneck. Without monitoring at the node level, these localized issues might fly under the radar until they cause larger-scale problems.
When CPU usage exceeds 85%, the risk of performance issues and instability rises. Unlike memory overuse, which triggers "OOMKilled" events, high CPU usage leads to throttling. This occurs when the system limits a container's CPU allocation, slowing applications without outright crashing them. The result? Readiness probes may fail, pods may restart, and services may experience disruptions.
Optimizing Resources and Costs
Keeping an eye on node CPU usage isn't just about avoiding issues - it also helps with resource planning and saving money. By comparing CPU usage to pod resource "requests" and "limits", you can adjust workloads to operate more efficiently, potentially cutting cloud costs. Tools like the Horizontal Pod Autoscaler (HPA) and Vertical Pod Autoscaler (VPA) rely on CPU metrics to scale pods dynamically or adjust their resource requests.
Starting with Kubernetes v1.34, new Pressure Stall Information (PSI) metrics, such as container_pressure_cpu_stalled_seconds_total, allow for deeper insights into CPU contention. These metrics show how often tasks are delayed due to resource contention, with averages computed over 10-second, 60-second, and 5-minute intervals. Monitoring these can help you spot resource bottlenecks before they escalate into full-blown failures.
Catching Problems Early
Set alerts for when CPU usage exceeds 85–90% for more than five minutes, aiming to keep nodes comfortably below 70% in normal conditions.
"Creating alerts on certain metrics can also warn you of impending failures, which helps reduce time to resolution." - Michael Levan, Grafana
CPU throttling metrics can also reveal under-provisioned pods that are struggling silently, performing poorly without outright crashing. For quick checks, the kubectl top nodes command provides a real-time view of CPU and memory usage across your cluster.
These tools and strategies make it easier to stay ahead of potential issues.
Simplifying Monitoring with Common Tools
Node CPU metrics are typically collected via the Kubelet Summary API and cAdvisor. Prometheus scrapes these metrics and integrates them with tools such as Grafana, enabling correlation of CPU spikes with application performance issues. Deploying monitoring agents as a DaemonSet ensures that all nodes are covered as your cluster grows.
For short-term, live data, the Metrics-Server powers commands like kubectl top. On the other hand, Prometheus stores historical data, which is crucial for spotting long-term trends and seasonal usage patterns. A key metric to watch is node_cpu_usage_seconds_total, which tracks the cumulative CPU time used by a node in core-seconds.
With these tools, monitoring becomes more straightforward, helping you maintain a healthy and efficient Kubernetes environment.
2. Node Memory Utilization
Relevance to Kubernetes Cluster Health
Monitoring memory usage at the node level is essential for maintaining a healthy Kubernetes cluster. While CPU metrics provide valuable insights, memory utilization offers a more focused view of resource health at the node level. A single container with a memory leak and no resource limits can monopolize a node's memory, disrupting every other pod running on the same host. Kubernetes defines memory as the "working set", referring to the portion of memory actively in use under pressure. This gives a more accurate picture of resource consumption.
Cluster-wide averages can sometimes hide critical issues. For example, an overall memory usage of 50% might seem fine, but could mask a single node running at 100%. This makes node-level monitoring indispensable. The node_memory_working_set_bytes metric is considered stable in Kubernetes, ensuring its consistency across API updates. Monitoring this metric enables early detection of issues, allowing quick responses before they escalate.
Ability to Detect and Resolve Issues Early
When node memory utilization approaches 100%, it often signals a memory leak or an improperly configured workload. Such situations can lead to pod evictions or even node instability. By tracking memory usage at the node level, you can not only identify the issue but also trace its source, thereby speeding up resolution.
Setting alerts for memory usage exceeding 80–90% can help you intervene before a node becomes unresponsive. Starting with Kubernetes v1.34, you can also use Pressure Stall Information (PSI) metrics like container_pressure_memory_stalled_seconds_total. These metrics, still in beta, track how long processes are stalled due to insufficient memory. However, they require Linux kernel 4.20 or later and cgroup v2.
Ease of Monitoring with Common Tools
Monitoring memory metrics is straightforward with widely-used tools. For a quick snapshot of memory usage across nodes, use the command kubectl top nodes. This command pulls real-time data from the metrics-server, which queries kubelets. It supports both manual checks and automated scaling.
For more detailed historical data and advanced visualizations, Prometheus is a go-to solution. It scrapes metrics in OpenMetrics format from kubelet endpoints like /metrics/resource and /metrics/cadvisor. These metrics can then be visualized in Grafana dashboards, such as the "Kubernetes Node Dashboard", which provides insights into system load, memory usage, and disk I/O in real time.
3. Pod Memory Usage
Relevance to Kubernetes Cluster Health
Monitoring pod memory usage provides a more precise understanding of cluster health compared to relying on overall averages. While node metrics offer a broad view, pod metrics focus on application-specific issues. For example, a cluster with 50% memory utilization might seem fine, but that average can hide a single pod with a memory leak consuming 100% of a node's resources. This makes pod-level monitoring essential for maintaining stability in your Kubernetes environment.
The pod_memory_working_set_bytes metric, marked as STABLE in Kubernetes v1.35, adheres to strict API contracts for long-term dependability. It measures the "working set" - the memory actively in use and not reclaimable under pressure. A steady increase in this metric may signal a memory leak at the pod level.
Impact on Resource Optimization
Monitoring pod memory usage helps ensure resources are allocated effectively. The Metrics API provides near-real-time data with a 30-second window for resource-usage calculations. This data is critical for Kubernetes autoscalers, including Vertical Pod Autoscalers (VPA) and Horizontal Pod Autoscalers (HPA), which adjust resource quotas or scale replicas based on actual demand. Comparing pod_memory_working_set_bytes with kube_pod_resource_limit can highlight pods approaching their memory limits, which could lead to issues like CrashLoopBackoff. Setting memory limits for each container is a practical way to prevent a single memory leak from overwhelming a node's resources.
Ease of Monitoring with Common Tools
The kubectl top pod command provides a quick overview of resource usage across your pods, though new metrics may take a moment to appear. For a more detailed breakdown, use kubectl top pod --containers to view container-specific memory usage.
For historical data and advanced analysis, Prometheus collects metrics from kubelet endpoints such as /metrics/resource and /metrics/cadvisor. These metrics are powered by cAdvisor, a daemon integrated into the kubelet that gathers and exposes container-level data. Tools like Grafana can then visualize this data, helping you track trends over time and set alerts for critical thresholds, such as when memory usage exceeds 90%.
4. API Server Request Latencies
Relevance to Kubernetes Cluster Health
API server latency is just as crucial as node and pod metrics for understanding your cluster's performance. Acting as the central gateway for the control plane, the API server processes every command - whether it's scheduling pods or handling kubectl requests. If latency increases here, the entire cluster feels the slowdown.
By monitoring API server request latency, you can determine whether performance issues originate from the API server itself or from downstream components such as etcd. Since the API server is the only component that directly interacts with etcd, its latency often reflects the cluster's overall responsiveness. For instance, if etcd latency spikes to 15 seconds, it could account for most of a 20-second request delay. This makes API server latency a key metric for early detection of potential problems.
Ability to Detect and Resolve Issues Early
High latency often indicates capacity issues or overburdened API queues. Keeping tabs on the rest_client_request_duration_seconds_bucket metric can help you spot anomalies before they escalate. While Kubernetes API requests have a default timeout of 60 seconds, most should finish in under 100 milliseconds.
"When combined with apiserver_request_latencies_count, it can give you insight into whether the cluster is at full capacity and starting to lag." - Michael Levan, Grafana
Pay close attention to inefficient LIST requests, as they can overwhelm the control plane. Additionally, mutating and validating admission controllers contribute to request duration, so monitoring their latency can help identify slow webhooks.
Ease of Monitoring with Common Tools
Tracking these latencies is straightforward with widely-used tools.
The apiserver_request_duration_seconds metric, classified as STABLE, is reliable and provides a detailed breakdown of response times by verb (e.g., GET, POST, LIST) and resource type. This makes it easier to pinpoint which operations are causing delays.
Prometheus collects these metrics from the API server's /metrics endpoint by default. Using Grafana and Prometheus to monitor Kubernetes, you can visualize latency distributions and quickly identify requests nearing the 60-second timeout. Comparing API latency spikes with etcd's "slow apply" counters can reveal if the storage backend is under strain. If specific verbs, such as LIST, exhibit high latency, audit logs can help identify the User Agent or application causing the bottleneck.
For more focused guidance, MetricFire offers resources to fine-tune API server monitoring.
5. Kubelet Runtime Operations Latency
Relevance to Kubernetes Cluster Health
The kubelet acts as the bridge between the control plane and individual nodes, translating pod specifications into actual container actions. The kubelet_runtime_operations_latency_microseconds metric tracks how long it takes for the kubelet to complete tasks via the Container Runtime Interface (CRI), such as creating containers or pulling images. As latency increases, pods may become stuck in "Pending" or "ContainerCreating" states, directly affecting application availability. Since the kubelet handles every container lifecycle event on a node, high latency could indicate hardware issues (e.g., slow disk I/O or CPU bottlenecks) or problems with the container runtime (e.g., containerd, CRI-O). This metric provides a deeper look into the performance of core container lifecycle operations, complementing earlier analyses of node and pod metrics.
Ability to Detect and Resolve Issues Early
Rising runtime latency often signals deeper infrastructure issues. Spotting these spikes early can prevent nodes from entering a "NotReady" state or causing widespread application disruptions.
"kubelet_runtime_operations_latency_microseconds indicates the latency of each operation by type in microseconds. Like other latency metrics, it is useful for optimization and bottleneck detection." - Michael Levan, Grafana Labs
This metric’s precision, measured in microseconds, enables fine-tuned monitoring. Correlating it with the kubelet_running_container_count metric can be particularly helpful - if both metrics are climbing, it may point to resource exhaustion.
Ease of Monitoring with Common Tools
The kubelet exposes these metrics in Prometheus format at its /metrics endpoint, making it straightforward to integrate into monitoring systems. Prometheus can scrape this data, and tools like Grafana can visualize it alongside container counts and system load. Setting baseline thresholds for operations like container_status or pull_image can help identify deviations that signal runtime or storage issues. To access these metrics, ensure the proper ClusterRole permissions are configured.
6. Pending Pods
Relevance to Kubernetes Cluster Health
A Pending Pod in Kubernetes means the API server has accepted the Pod, but it hasn’t been scheduled on any node yet. This typically indicates a problem with workload scheduling, such as resource shortages, misconfigured scheduling rules, or infrastructure issues, including unbound PersistentVolumeClaims.
"The Pending phase is Kubernetes' way of saying: 'I've accepted your Pod, but I can't run it anywhere yet.'" - Vijay Aggarwal, CubeAPM
When Pods are stuck in the Pending phase, they can disrupt rolling updates and block dependent services. Ideally, a healthy Kubernetes cluster should have no Pending Pods. Common reasons for Pending Pods include insufficient CPU or memory on nodes, overly restrictive scheduling rules, or storage-related delays in which Pods wait for PersistentVolumes to be provisioned.
Impact on Resource Optimization
Monitoring Pending Pods offers valuable insight into your cluster’s resource usage. It helps identify whether you’re overprovisioning (setting resource requests too high for available nodes) or underprovisioning (insufficient physical resources to support the workload). When Pods remain in Pending, they waste compute capacity. Running kubectl describe pod <pod-name> can reveal specific issues, such as "0/X nodes available: insufficient memory", helping you determine whether to scale out your node pool or adjust resource requests.
Ability to Detect and Resolve Issues Early
Setting alerts for Pods that remain Pending for more than 5 minutes can help you catch deployment issues before they escalate. Metrics like kube_pod_status_phase{phase="Pending"} from kube-state-metrics provide a centralized view of stuck workloads. Combining this with scheduler_pending_pods can reveal whether scheduling problems are affecting the entire cluster or just specific nodes. These alerts can be integrated into dashboards, ensuring continuous monitoring and proactive issue resolution.
Ease of Monitoring with Common Tools
Tools like Prometheus and Grafana make it easy to monitor Pending Pods. The kube-state-metrics component exposes the kube_pod_status_phase{phase="Pending"} metric in a format that Prometheus can scrape, allowing for visualization on Grafana dashboards. Grafana can also correlate node pressure (such as CPU or memory usage) with the number of Pending Pods, helping to identify whether the issue is widespread or localized to specific nodes. For deeper analysis, monitoring the kube_pod_resource_request metric alongside Pending Pod counts can highlight workloads unable to schedule due to resource constraints.
For more tips on monitoring Kubernetes, consider booking a MetricFire demo.
7. Node Status Conditions
Relevance to Kubernetes Cluster Health
Node status conditions provide a high-level overview of the health of individual nodes in your Kubernetes cluster. These conditions are API fields that reflect the current state of each node. The most important condition is Ready, which shows whether a node is operational and capable of running pods. Other typical conditions include DiskPressure, MemoryPressure, PIDPressure, and NetworkUnavailable.
When negative conditions like MemoryPressure occur, Kubernetes automatically applies taints to the affected node. This prevents new pods from being scheduled there, helping to safeguard the cluster from further disruptions.
| Node Condition | Description | Healthy Node Status |
|---|---|---|
| Ready | Node is healthy and ready to accept pods | True |
| DiskPressure | Disk capacity is low | False |
| MemoryPressure | Node memory is low | False |
| PIDPressure | Too many processes are running on the node | False |
| NetworkUnavailable | Network for the node is not correctly configured | False |
"Monitoring the cluster metrics would show roughly 50% memory utilization. It's not very useful information, nor is it alarming... but what would happen if you go down a level and monitor the metrics of each node? In that case, one of the nodes would show 100% memory usage - this would reveal a problem." - Michael Levan, Consultant and Content Creator
Cluster-wide metrics can sometimes hide issues affecting individual nodes. Monitoring node-specific conditions helps detect these problems early, preventing them from escalating into larger disruptions.
Ability to Detect and Resolve Issues Early
The kubelet updates the node's Lease object (a lightweight heartbeat) every 10 seconds. Meanwhile, the node controller checks each node's status every 5 seconds. If a node doesn't respond within 50 seconds, its Ready status is marked as Unknown. After 5 minutes in this state, the node controller begins evicting pods at a controlled rate of 0.1 pods per second, ensuring no more than one node is evicted every 10 seconds.
For deeper insights, use the Node Problem Detector as a DaemonSet. This tool identifies system-level issues such as kernel deadlocks or disk corruption and reports them as Node Conditions. By scanning system logs, it can uncover problems that standard health checks might overlook, enabling faster resolution.
Ease of Monitoring with Common Tools
The kube-state-metrics component makes node health data accessible by exposing the kube_node_status_condition metric. Prometheus can scrape this data to track node conditions over time. Pair this with Grafana dashboards to visualize node health alongside system metrics like load and resource usage. Setting up alerts for conditions that persist - such as a True state for pressures or False/Unknown for readiness - ensures you can tackle issues before they cascade into cluster-wide problems.
Integrating these tools into your monitoring setup provides a clearer view of your cluster's health and improves overall stability.
8. Deployment Status
Relevance to Kubernetes Cluster Health
After analyzing node conditions, deployment metrics provide another layer of insight into how well your services align with their intended state.
Kubernetes operates on a declarative model: you define the desired state, and the system enforces it. Deployment status metrics are critical for confirming whether the actual state matches your configuration goals. For instance, the kube_deployment_status_replicas_unavailable metric highlights pods that are currently unable to handle traffic, allowing you to catch problems before they affect users. Imagine a scenario where your overall cluster metrics show acceptable memory usage, but a specific deployment is struggling because a node has reached its capacity. By ensuring your deployments maintain the desired replica count, you protect both service reliability and cluster efficiency.
| Metric Name | Description | Why It Matters |
|---|---|---|
kube_deployment_status_replicas_unavailable |
Number of pods not available in a deployment | Flags service disruptions and deployment issues |
kube_deployment_spec_replicas |
Number of pods desired to be running | Confirms that deployment matches its defined specifications |
Ability to Detect and Resolve Issues Early
Monitoring the gap between desired and actual replicas is key to quickly identifying problems. Comparing these metrics with node resource usage can help pinpoint whether the issue is container-specific (like a memory leak) or tied to broader resource constraints in the cluster.
"Creating alerts on certain metrics can also warn you of impending failures, which helps reduce time to resolution." - Michael Levan, Author
For example, you can set up alerts for the kube_deployment_status_replicas_unavailable metric to trigger when it stays above zero for more than five minutes. This gives your team a chance to investigate and address issues before they escalate into production outages. Monitoring these metrics in development and staging environments also helps catch configuration mistakes early, preventing them from reaching live systems.
Ease of Monitoring with Common Tools
The kube-state-metrics service makes deployment monitoring straightforward by pulling data from the Kubernetes API server and generating metrics about object states. Unlike the Metrics Server, which focuses on resource usage, kube-state-metrics focuses on whether deployments have the correct number of running replicas. Tools like Prometheus can scrape these metrics for analysis, while Grafana dashboards provide real-time visuals of deployment health. For instance, the "Kubernetes / Compute Resources / Pod" dashboard in Grafana is excellent for quickly spotting deployment issues. Additionally, retaining historical deployment data enables deeper root-cause analysis when recurring problems arise.
9. Probe Count
Relevance to Kubernetes Cluster Health
Tracking probe counts is essential for understanding how Kubernetes monitors container health. The prober_probe_total metric, a cumulative counter, logs every liveness, readiness, and startup probe executed by the kubelet on containers. This metric includes labels like container, namespace, pod, probe_type, and result, making it possible to pinpoint which checks succeed or fail.
Here’s a quick breakdown of the probes:
- Startup probes confirm that an application has fully initialized before other health checks kick in.
- Readiness probes ensure a container is ready to handle traffic.
- Liveness probes verify if a container is functioning as expected and restart it if needed.
If probe counts start dropping, it could indicate resource issues in the kubelet or control plane.
"Probes are really powerful yet often neglected tools that can maximize your app's availability." - Padok
By monitoring these metrics, you can address potential problems before they escalate.
Ability to Detect and Resolve Issues Early
The result label in probe metrics can act as an early warning system. A rise in "Failure" results signals that a container may be heading toward instability, potentially avoiding a CrashLoopBackOff scenario. For instance, even a modest 10% failure rate in probes can lead to service disruptions. A real-world example demonstrated how a liveness probe targeting a /healthz endpoint with a 5-second periodSeconds interval allowed Kubernetes to catch internal server errors and restart failing containers after three consecutive failures, ensuring the application remained available.
You can also monitor the ratio of failed to successful probes to identify "flapping" containers - those that alternate between passing and failing checks. These containers might appear "Running" in cluster dashboards but could be masking deeper issues. Additionally, cross-referencing probe results with kubelet_runtime_operations_latency_microseconds can uncover node-level bottlenecks slowing down health checks.
Ease of Monitoring with Common Tools
Probe metrics are straightforward to monitor and provide actionable insights. The kubelet serves these metrics at the /metrics/probes endpoint in Prometheus format, making them easy to collect and visualize. With the prober_probe_total metric classified as Beta in Kubernetes version 1.35, it offers a stable API contract, with possible future label additions. You can configure Prometheus to scrape these metrics and set up Grafana alerts for spikes in prober_probe_total{result="failed"}, ensuring quick detection of issues.
Fine-tuning your probe settings, like initialDelaySeconds and periodSeconds, based on your app’s startup behaviour, can help prevent false-positive restarts.
If you'd like tailored guidance on monitoring, you can book a demo with the MetricFire team here: MetricFire Demo.
10. Etcd Request Latencies
Relevance to Kubernetes Cluster Health
After metrics such as CPU, memory, and probe counts, etcd request latencies are another key indicator of control-plane health. They help gauge the cluster's responsiveness under varying conditions.
Etcd serves as the single source of truth for cluster data, configurations, secrets, and service discovery. If etcd slows down, it can disrupt the entire control plane, leading to delays or even complete cluster failure. Monitoring these latencies provides early warnings and helps resolve issues before they escalate.
One critical metric to watch is etcd_server_has_leader. When this binary gauge drops to 0, it indicates a total loss of availability for that etcd member. As Michael Levan from the Grafana Blog explains:
"etcd_server_has_leader is a valuable metric to detect if the cluster has lost its lead node, which is usually due to a network failure."
Ability to Detect and Resolve Issues Early
Certain disk latency metrics act as early warning signs for potential problems. For example:
-
etcd_disk_wal_fsync_duration_seconds: Measures the time to persist log entries to disk. -
etcd_disk_backend_commit_duration_seconds: Tracks the time to commit incremental snapshots.
Both metrics are critical because high disk latency can lead to instability or slow request handling. The etcd documentation highlights:
"High disk operation latencies (wal_fsync_duration_seconds or backend_commit_duration_seconds) often indicate disk issues. It may cause high request latency or make the cluster unstable."
Other important indicators include:
-
proposals_committed_totalvs.proposals_applied_total: A growing gap suggests overload, often caused by large transactions or expensive queries. -
leader_changes_seen_total: Frequent leadership changes can degrade performance and point to network or load-related issues.
Ease of Monitoring with Common Tools
Etcd metrics are exported in Prometheus format by default via the /metrics endpoint, making them easy to integrate with tools like Prometheus and Grafana. For kubeadm clusters, ensure the etcd manifest includes the --listen-metrics-urls=http://0.0.0.0:2381 flag to enable Prometheus scraping.
| Metric | Warning Threshold (p99) | Critical Threshold (p99) |
|---|---|---|
| WAL fsync duration | > 100ms | > 500ms |
| Backend commit duration | > 100ms | > 250ms |
| gRPC request latency | > 150ms | N/A |
| Peer Round Trip Time (RTT) | > 100ms | > 200ms |
Set alerts for metrics like etcdHighFsyncDurations (p99 > 0.5s) and etcdGRPCRequestsSlow (p99 > 0.15s) to avoid potential outages. Additionally, you can use the etcdctl check perf command to manually test cluster performance. Given etcd's sensitivity to disk write latency, production environments should prioritize dedicated SSDs or high-performance NVMe storage.
For more tailored advice, consider scheduling a demo with the MetricFire team to discuss your specific monitoring needs. You can also explore more insights on the MetricFire Blog.
Kubernetes Monitoring 101: A Practical Walkthrough
How to Implement Kubernetes Monitoring
Setting up Kubernetes monitoring effectively requires combining the right tools to ensure seamless performance tracking. Prometheus is often the backbone of this process. It scrapes metrics from targets at regular intervals and stores them as time-series data with labels, making it a reliable choice for cloud-native environments. Thanks to its proven track record, Prometheus has become the go-to solution for Kubernetes monitoring.
For visualization, Grafana pairs perfectly with Prometheus by creating real-time dashboards. Keep these dashboards straightforward to quickly spot patterns and issues. Use aggregated dashboards for high-level insights and more detailed ones for troubleshooting. As your environment grows, consistent layouts and tagging will help maintain clarity. These dashboards also integrate well with autoscaling metrics, providing a unified view of your cluster's performance.
To link monitoring with autoscaling, deploy the Metrics Server. This lightweight tool collects resource metrics from kubelets, enabling features like the Horizontal Pod Autoscaler (HPA) and the kubectl top command. For more advanced autoscaling, such as scaling based on application-specific metrics like request rates, you can integrate Prometheus with a custom metrics adapter to monitor RED (Rate, Errors, Duration) metrics.
Additional tools enhance monitoring capabilities. Use kube-state-metrics to track object states like deployment statuses and node conditions, while cAdvisor provides container-level insights into CPU and memory usage. To balance real-time monitoring with system efficiency, set Prometheus's scrape_interval to 15 seconds.
When setting up alerts, focus on metrics that signal issues needing immediate attention. For instance, you could configure alerts for scenarios where kube_deployment_status_replicas_unavailable stays above zero for too long or when scheduler_e2e_scheduling_duration_seconds exceeds acceptable latency, indicating resource allocation problems. Integrating these alerts ensures you can proactively address performance issues.
For expert guidance on optimizing your Kubernetes cluster, consider booking a demo with the MetricFire team.
Conclusion
Tracking these 10 key metrics gives you a clear view of your entire Kubernetes environment - from individual containers to the control plane. By concentrating on these metrics, you can pinpoint whether performance issues stem from a specific pod, an overloaded node, or a slow API server. Without proper correlation, troubleshooting becomes little more than guesswork.
"You can't understand the state of Kubernetes, or find and fix performance issues, if you don't systematically monitor and correlate metrics from across your cluster." – Aviv Zohari, Founding Engineer, Groundcover
Monitoring these metrics also helps prevent resource exhaustion and downtime, keeping your cluster responsive. Early warning signs, such as rising pending pod counts or anomalous probe responses, allow you to act before users are affected. Real-time data enables automation - Horizontal Pod Autoscalers, for example, use CPU and memory metrics to dynamically adjust workloads and optimize resource usage.
To make the most of these insights, consider deploying a full Prometheus and Grafana monitoring pipeline instead of relying solely on the Metrics Server. This setup provides historical data and trend analysis for long-term performance tuning. Proactively setting up alerts for critical metrics and consistently labeling resources ensures easier filtering and monitoring across deployments.
Ready to streamline your monitoring strategy? Sign up for a free trial to start monitoring your infrastructure today. Or, book a demo to discuss your specific needs with the MetricFire team.
FAQs
What are the best tools for monitoring Kubernetes metrics?
For monitoring Kubernetes effectively, Prometheus and Grafana are standout tools. Prometheus specializes in gathering and storing metrics, making it a reliable choice for tracking performance data. On the other hand, Grafana shines with its robust visualization features, helping you analyze and interpret those metrics with ease.
Together, these tools form a powerful combination. They enable you to monitor cluster performance, fine-tune resource allocation, and address issues before they escalate. In short, they play a key role in keeping Kubernetes environments stable and efficient.
Why is monitoring node CPU usage important for managing resources and controlling costs in Kubernetes?
Monitoring node CPU usage is crucial for managing resources and controlling costs in Kubernetes environments. By examining how the CPU is utilised across nodes, you can identify underutilised nodes that may be good candidates for workload consolidation. On the flip side, overutilized nodes could indicate performance issues that require attention. This kind of analysis helps ensure resources are distributed efficiently, avoiding waste and preventing bottlenecks.
Tracking CPU usage trends also plays a key role in future planning. It allows you to make informed scaling decisions in advance, reducing the risk of unexpected cost spikes and keeping your infrastructure balanced between performance and budget. Regularly monitoring this metric helps ensure your Kubernetes clusters remain efficient and cost-effective.
Why is monitoring etcd request latencies critical in Kubernetes?
Monitoring etcd request latencies is crucial because etcd serves as the core database for a Kubernetes cluster, storing all its state and configuration. When latencies spike, it can indicate problems such as resource contention, network latency, or server overload. These issues can slow API responses and compromise cluster stability.
By tracking these latencies, administrators can catch bottlenecks early and address them before they escalate. Since etcd is central to operations like scheduling, service discovery, and configuration management, its performance directly affects the cluster's reliability and responsiveness. Tools such as Prometheus are great for monitoring these metrics, helping to keep operations smooth and downtime to a minimum.
Sign up for the free trial and begin monitoring your infrastructure today. You can also book a demo and talk to the MetricFire team directly about your monitoring needs.

