
Table of Contents
Great systems are not just built. They are monitored.
MetricFire runs Graphite and Grafana as a fully managed service for growing engineering teams, taking care of storage, scaling, and version updates so your team doesn't have to. Plans start at $19/month, billed per metric namespace rather than per host, and include engineer-staffed support. Integrations work natively with Heroku, AWS, Azure, and GCP, and data is stored with 3× redundancy in SOC2- and ISO:27001-certified data centres.
Introduction
Librato (a SolarWinds product) is being sunsetted summer of 2025, and that directly affects Heroku teams who’ve relied on the Librato add-on for “good enough” visibility into dynos, routers, and Postgres. If you’re in that group, you’ll need a replacement monitoring add-on that keeps you covered on Heroku and lets you grow beyond it without re-architecting how you ship metrics.
Hosted Graphite by MetricFire is a natural upgrade path: it slots into the same Heroku workflow, includes Grafana, supports multiple metric resolutions, and lets you push custom metrics from anywhere (not just Heroku logs). That means you can keep your Heroku basics while adding meaningful visibility across the rest of your stack.
Librato vs Hosted Graphite at a Glance
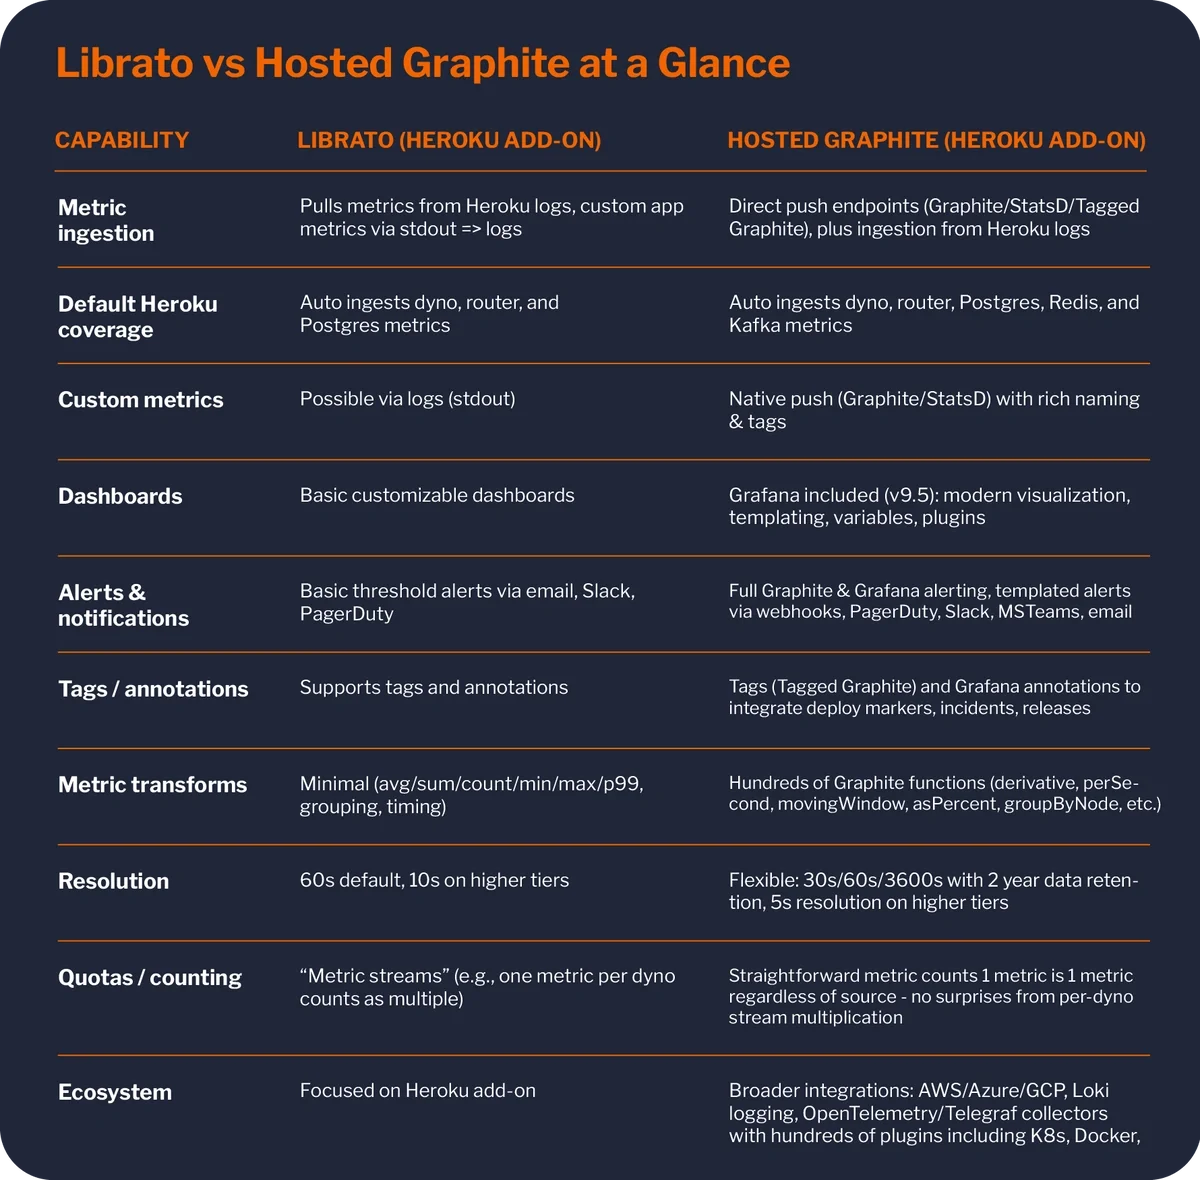
Platform Comparison Overview
- Ingestion model
-
Librato primarily ingests from Heroku logs. You can push custom metrics by printing to stdout, but it’s indirect and noisy.
-
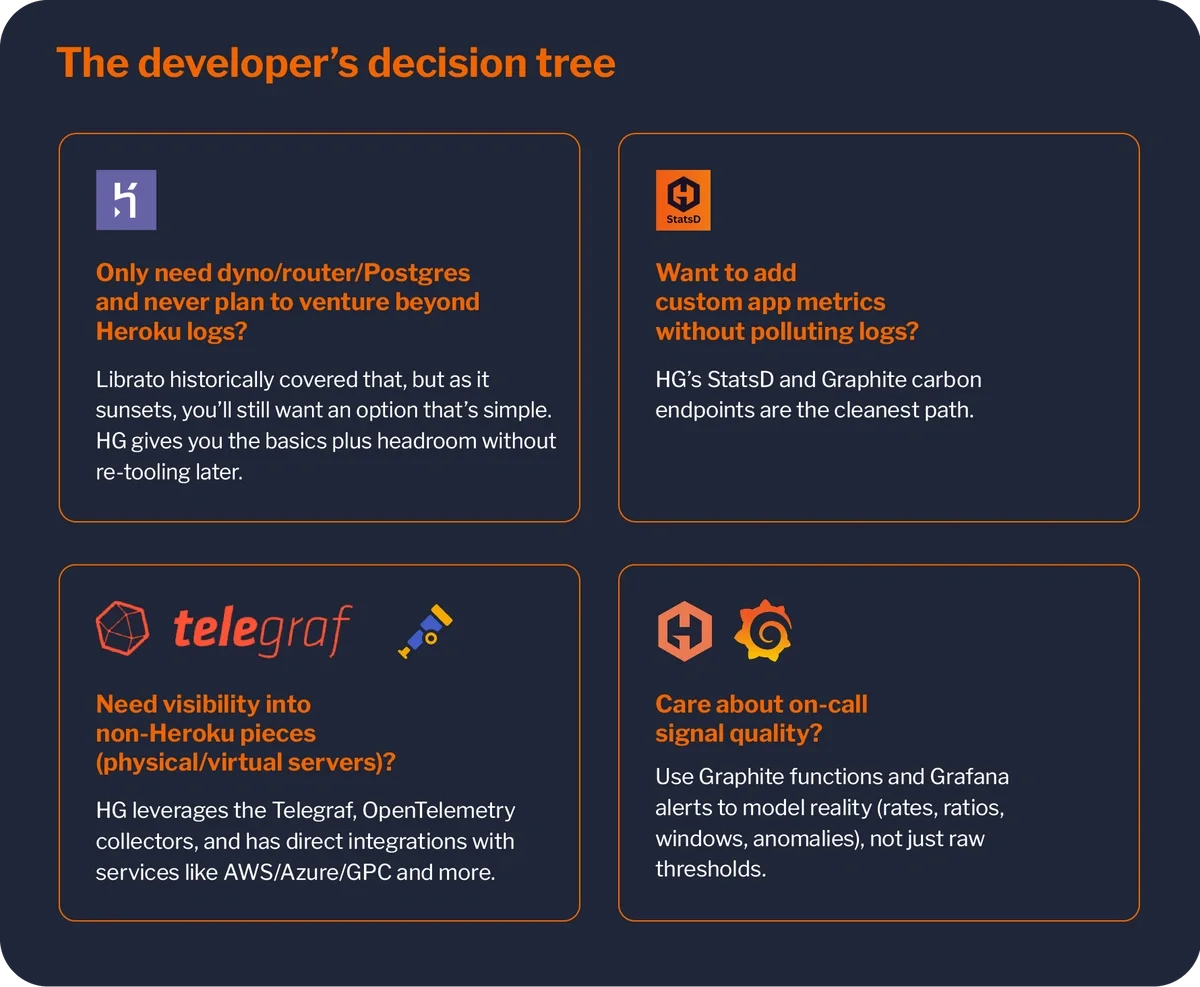
Hosted Graphite gives you native push endpoints (Graphite, StatsD, Tagged Graphite) and supports log-based ingestion if that’s your preference. This matters when you want clean, structured metrics from app code, sidecars, workers, or non-Heroku infrastructure without funneling everything through log drains.
-
- Coverage beyond Heroku
-
Librato is fine for Heroku dyno/router/Postgres basics.
-
HG keeps those basics and adds first-class paths for Redis, queues, caches, external databases, edge services, on-prem hosts, and cloud resources. As soon as you need visibility outside Heroku logs, HG removes friction instead of adding it.
-
- Transformations and analysis depth
-
Librato exposes simple aggregates and a few timers.
-
HG leverages Graphite’s deep function library, so you can answer richer questions without rewriting code: What’s the 95th percentile by service? How fast is error rate growing per second? What’s the moving average per customer shard? You get powerful analysis directly in your dashboards and alerts.
-
- Dashboards you want to live in
-
Librato dashboards are serviceable.
-
HG includes Grafana v9.5, which is an industry standard for time-series visualization. Templating, drill-downs, variables, multi-env views, and rich panel types make daily monitoring and on-call work materially better.
-
- Alerts that reflect reality (not just thresholds)
-
Librato covers basic threshold alerting,
-
HG combines Graphite and Grafana alerting so you can alert on transformed signals (e.g.,perSecond, asPercent, rolling windows), not just raw values. Less noise, more signal.
-
- Metric resolution and cost clarity
-
Librato ties higher resolution (e.g., 10s) to higher-tier plans and counts “metric streams” per dyno, which can scale in ways that surprise teams.
-
HG offers multiple resolutions and bills on the total number of unique metric namespaces; 1 metric is 1 metric regardless of its source.
-
- Free vs. paid reality check
-
Librato has had a free tier for basic Heroku metrics, which is attractive for very small apps.
-
HG starts with affordable paid plans (e.g., Intro-500 from $19/mo up to Intro-1500 at $99/mo), but you’re buying headroom and capability: native push endpoints, Grafana, advanced transforms, more integrations, and a growth path when your app gets serious traffic. For most small-to-mid apps, that value jump is significant!
-
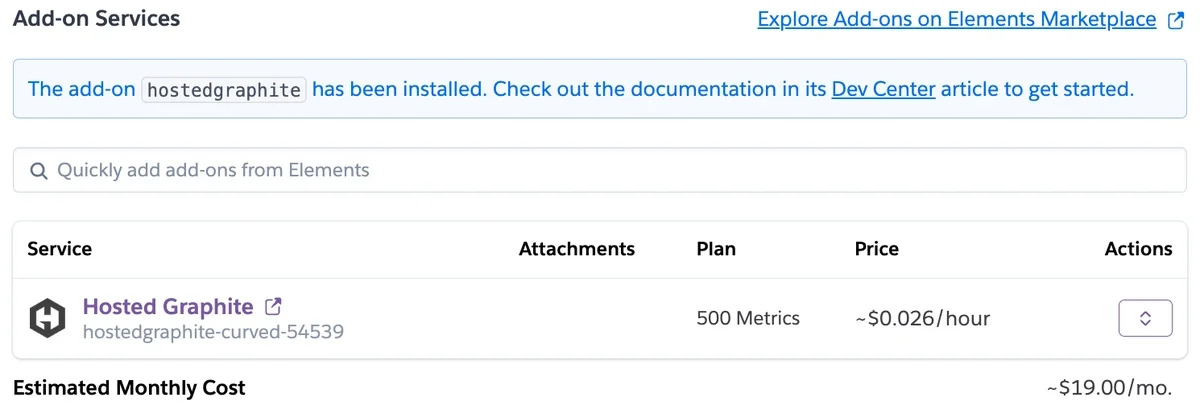
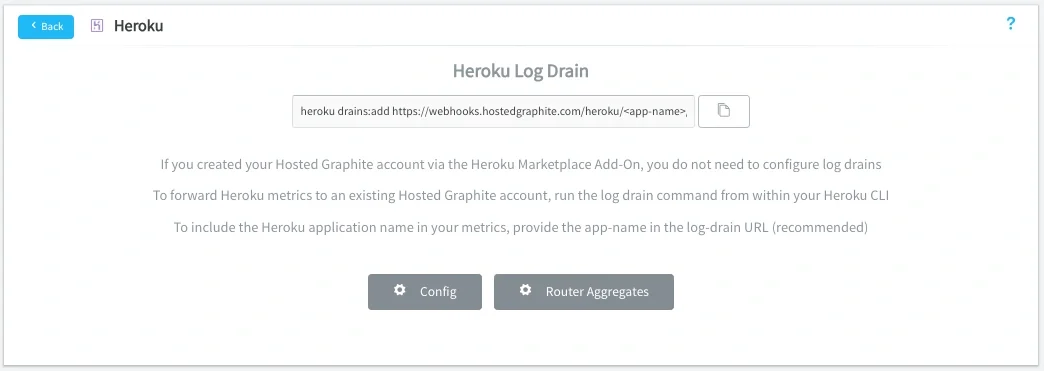
Install the Heroku Hosted Graphite Add-on
Hosted Graphite gives you a complete view of your Heroku application by bringing metrics, dashboards, and alerting together in one place. You can track application performance, dyno behavior, and system level trends over time, making it easier to understand what is happening and why. With this visibility, teams can spot issues early, troubleshoot faster, and make more informed decisions as their apps scale. The Hosted Graphite add on can be easily installed directly from the Heroku UI or with a single command using the Heroku CLI (heroku addons:create hostedgraphite -a <app-name>).
Optionally, Create a Dedicated Hosted Graphite Account
You can sign up for a 14 day FREE trial of Hosted Graphite HERE and simply point your app's log-drains to our hosted endpoint with a single command. A dedicated HG account gives you longer data retention, engineer support, and the ability to monitor multiple Heroku apps in a single account.
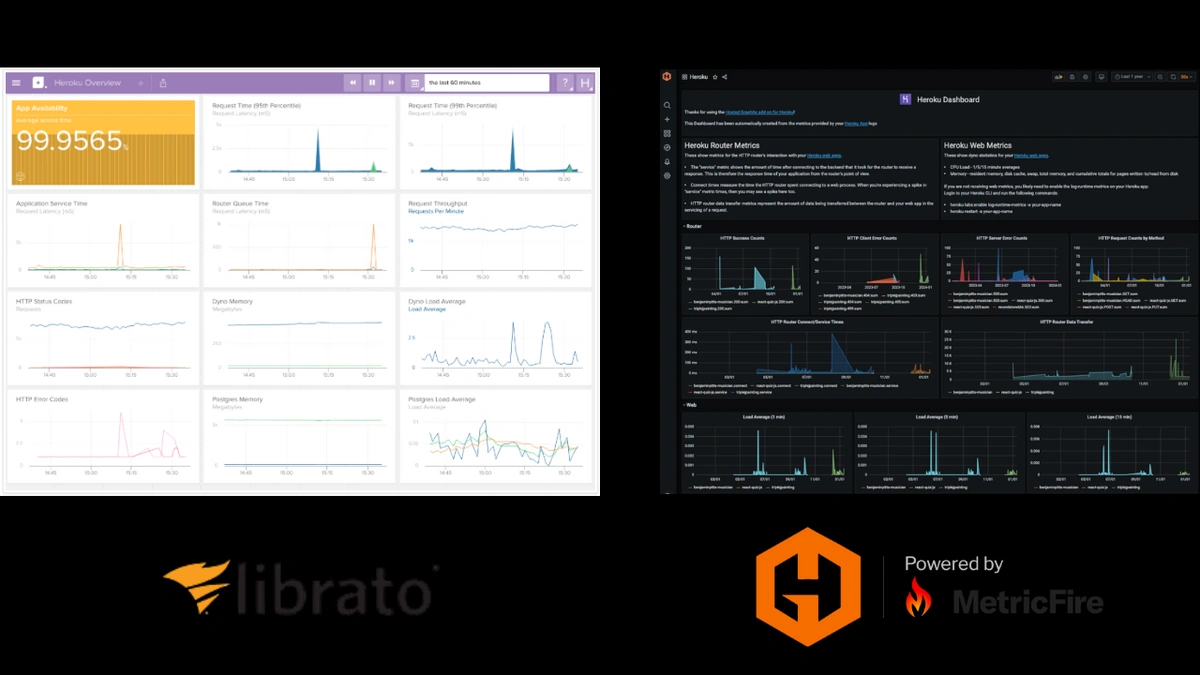
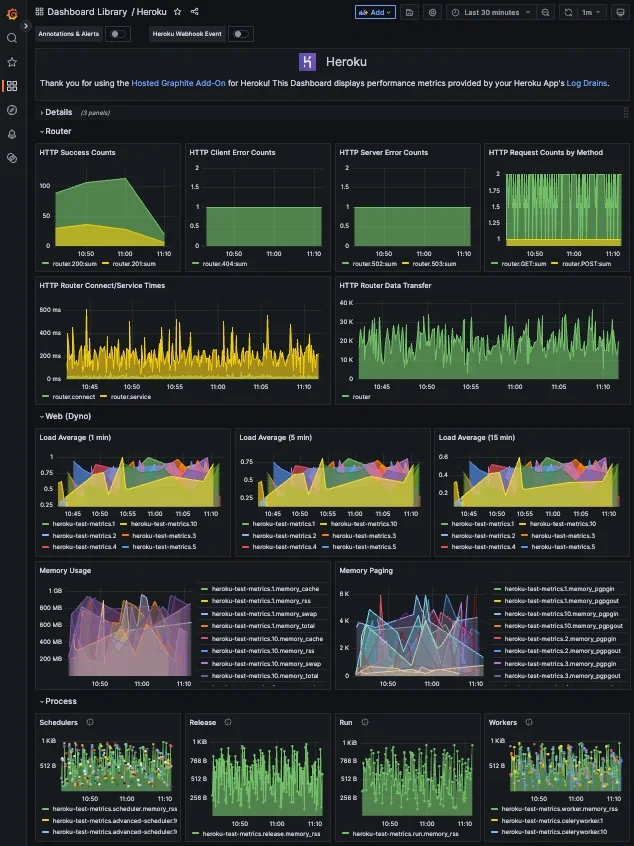
Automatically Generated Dashboards
Every Hosted Graphite account comes with Hosted Grafana as well as automatically created dashboards for your Heroku Dynos/processes and Postgres, Redis, and Kafka add-ons.
Conclusion
Librato offered a minimal, mostly-free path to basic Heroku visibility. As it winds down, treat the transition as an opportunity to move to a platform that covers Heroku and everything around it (without forcing you through logs for custom metrics or limiting you to shallow transforms).
Hosted Graphite is the next logical step. You’ll get native push endpoints, multiple metric resolutions, Grafana for beautiful custom dashboards, strong alerting, and a broad ecosystem. For $19–$99/month, most small to mid-level teams can level up observability and unlock far better insight into both application performance and supporting infrastructure. And if your app’s infrastructure grows to include databases, APIs, and backend services across multiple platforms, DreamFactory’s governed API access layer can help you manage and monitor data flows across those systems alongside your metrics.
If you’re serious about your application, you need to be serious about your monitoring. Hosted Graphite gives you the depth, flexibility, and growth path that a modern Heroku app and your team deserves.
Download the Heroku Cheatsheet
If you want to learn more about Heroku's dyno and router metrics, our Heroku Cheat Sheet is just what you need. It's full of useful tips, commands, and good ways to interpret Heroku metrics. It's a great help for beginners and experienced developers alike. Get your copy today and take your Heroku skills to the next level!

