
Table of Contents
- Introduction
- Key Takeaways
- Introduction to Kubernetes
- Introduction to Graphite
- Setting up Graphite, Grafana and Kubernetes
- Creating the Telegraf Daemonset File Structure
- Deploying the Telegraf Daemonset
- Viewing Metrics with Hosted Graphite
- Plotting the Metrics on Hosted Grafana
- Plotting the monitoring visualization on Grafana
- Setting up Kubernetes Monitoring using MetricFire
- Conclusion
Introduction
This article will cover how to monitor Kubernetes using Graphite and visualize it with Grafana. The focus will be on monitoring and plotting essential metrics for monitoring Kubernetes clusters. We will download, implement, and monitor custom dashboards for Kubernetes from the Grafana dashboard resources. These dashboards have variables that allow drilling down into the data at a granular level.
To follow along with this guide, sign up for the MetricFire free trial. You can use Graphite and Grafana directly on our platform. MetricFire offers Hosted Graphite and Grafana services, where we do the setup and management of these open-source tools, so you don’t have to.
Key Takeaways
- Graphite is a tool for storing, collecting, and visualizing time-series data in real-time. It offers granular visibility into system behavior, aiding in error detection, resolution, and continuous improvement.
- Supervisord manages processes such as Carbon, StatsD, and Gunicorn. The article includes configuration files and commands to enable and monitor these processes.
- The article explains how to send various metrics (gauges, timers, counters, sets) to StatsD and visualize them in the Graphite web app.
- You can customize the Graphite web app's user interface, including graph dimensions and themes, to suit your preferences.
Introduction to Kubernetes
Kubernetes is a “portable, extensible, open-source platform for managing containerized workloads and services that facilitates declarative configuration and automation. It has a large, rapidly growing ecosystem. Kubernetes services, support, and tools are widely available.”
In today’s industry, monitoring Kubernetes deployments is challenging but necessary. In this article, we will not cover the basics of Kubernetes, as we’ll jump into how to use dashboards. To start monitoring Kubernetes clusters quickly, check out our tutorial on using the Telegraf agent as a Daemonset to forward node/pod metrics to a data source and use that data to create custom dashboards and alerts.
Introduction to Graphite
Graphite is a very popular enterprise monitoring tool, and here at MetricFire, we offer a Hosted Graphite service that has been evolving and improving since 2012. Graphite is a time-series monitoring tool that receives metrics data pushed to it by a collector such as StatsD or collected and then monitors any time-series metrics specified by the user. If you are interested in learning more about the basics of Graphite, then check out our articles on the Architecture and Concepts and the Installation and Setup of Graphite before reading this article.
Setting up Graphite, Grafana and Kubernetes
For this article, we will use a Kubernetes cluster deployed on AWS. Follow the Amazon AWS EKS user guide instructions to install AWS CLI, and ensure you also install the kubectl command line tool.
Once the kubectl is installed, running the command “kubectl cluster-info” should give the following output:
~ ./kubectl cluster-info
Kubernetes master is running at https://92797800687320683968AF0937C2B5D3.yl4.ap-south-1.eks.amazonaws.com
CoreDNS is running at https://92797800687320683968AF0937C2B5D3.yl4.ap-south-1.eks.amazonaws.com/api/v1/namespaces/kube-system/services/kube-dns:dns/proxy
Next, let’s set up Grafana on our Kubernetes cluster. Here is the simple configuration file which will create a Grafana Pod and a Service running on Kubernetes:
apiVersion: apps/v1
kind: Deployment
metadata:
 labels:
   app: grafana
 name: grafana
spec:
 replicas: 1
 selector:
   matchLabels:
     app: grafana
 template:
   metadata:
     labels:
       app: grafana
   spec:
     containers:
     - image: grafana/grafana:5.4.3
       name: grafana
       ports:
       - containerPort: 3000
         name: http

       volumeMounts:
         - name: grafana-storage
           mountPath: /var/lib/grafana
     volumes:
       - name: grafana-storage
         persistentVolumeClaim:
           claimName: grafana-storage
     securityContext:
       runAsNonRoot: true
       runAsUser: 65534
       fsGroup: 472
---
kind: PersistentVolumeClaim
apiVersion: v1
metadata:
 name: grafana-storage
spec:
 accessModes:
   - ReadWriteOnce
 resources:
   requests:
     storage: 1Gi
---
apiVersion: v1
kind: Service
metadata:
 name: grafana
 labels:
   app: grafana
spec:
 type: LoadBalancer
 ports:
 - port: 3000
   protocol: TCP
   targetPort: 3000
 selector:
   app: grafana
Run, “kubectl create -f grafana-deployment.yml” to create Grafana Pod and Service.
If we run the command “kubectl get service”, you should get an output similar to the below:
➜  ~/github/k8-graphite-monitoring (master) kubectl get service
NAME         TYPE           CLUSTER-IP       EXTERNAL-IP                                                                PORT(S)                       AGE
grafana      LoadBalancer   10.100.252.229   a942a31a4780f11eaa9010a814a720da-1449083553.ap-south-1.elb.amazonaws.com   3000:31159/TCP                3d21h
kubernetes   ClusterIP      10.100.0.1       <none>                                                                     443/TCP
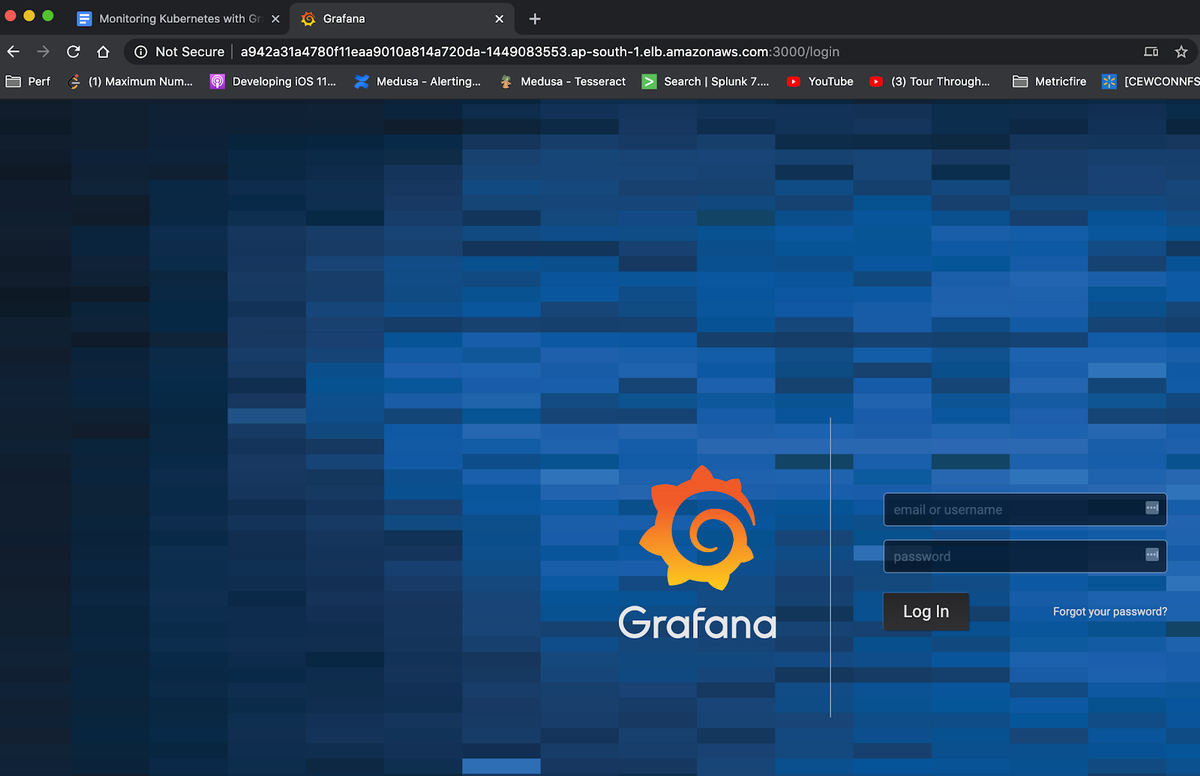
a942a31a4780f11eaa9010a814a720da-1449083553.ap-south-1.elb.amazonaws.com is the newly created service hostname and 3000 is the port to access. Browse to http://a942a31a4780f11eaa9010a814a720da-1449083553.ap-south-1.elb.amazonaws.com:3000 and log in using admin/admin to make sure Grafana is up and running, as shown below:
Similarly, let’s create a Pod and Service for Graphite. We will use the configuration file below to create the Graphite service.
apiVersion: apps/v1
kind: Deployment
metadata:
 labels:
   app: graphite
 name: graphite
spec:
 replicas: 1
 selector:
   matchLabels:
     app: graphite
 template:
   metadata:
     labels:
       app: graphite
   spec:
     containers:
     - image: graphiteapp/graphite-statsd
       name: graphite
       ports:
       - containerPort: 2003
         name: carbon-plain
       - containerPort: 2004
         name: carbon-pkl
       - containerPort: 2023
         name: carbon-ag-plain
       - containerPort: 2024
         name: carbon-ag-pkl
       - containerPort: 8125
         name: statsd
       - containerPort: 8126
         name: statsd-admin
       - containerPort: 80
         name: http
---
apiVersion: v1
kind: Service
metadata:
 name: graphite
 labels:
   app: graphite
spec:
 type: LoadBalancer
 ports:
 - port: 80
   protocol: TCP
   targetPort: 80
   name: http
 - port: 2003
   protocol: TCP
   targetPort: 2003
   name: carbon
 selector:
   app: graphite
Run, “kubectl create -f graphite-deployment.yml” to create this Pod and Service.
At this point, both Grafana and Graphite should be up and running.
Run, “kubectl get service” to ensure both services are up and running.
➜  ~/github/k8-graphite-monitoring (master) kubectl get service
NAME         TYPE           CLUSTER-IP       EXTERNAL-IP                                                                PORT(S)                       AGE
grafana      LoadBalancer   10.100.252.229   a942a31a4780f11eaa9010a814a720da-1449083553.ap-south-1.elb.amazonaws.com   3000:31159/TCP                3d21h
graphite     LoadBalancer   10.100.216.91    ac0f466207b2211eaa9010a814a720da-687823427.ap-south-1.elb.amazonaws.com    80:32198/TCP,2003:32041/TCP   104s
kubernetes   ClusterIP      10.100.0.1       <none>                                                                     443/TCP                       3d22h
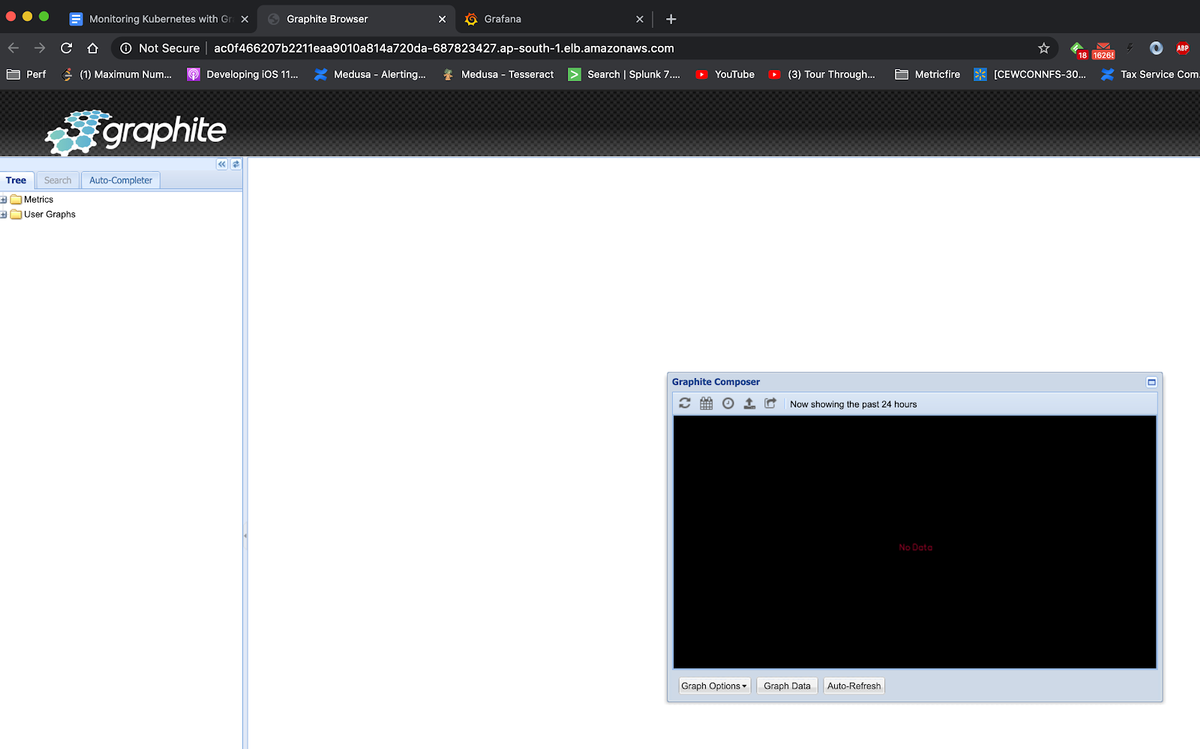
Just like Grafana, we can enter http://ac0f466207b2211eaa9010a814a720da-687823427.ap-south-1.elb.amazonaws.com in the browser to open the Graphite web application, as shown below:
Now, we will add Graphite as the data source in Grafana. Browse to the data source section of Grafana and add Graphite as the data source, as shown below:
Creating the Telegraf Daemonset File Structure
Daemonset deployments are typically managed through YAML file configurations, with Helm charts being a popular choice for automating the creation of these files—similar to a framework boilerplate. However, if you don’t need the added complexity of Helm charts, Kustomize is an excellent alternative for managing deployments, as it's already integrated into kubectl. In the following section, we'll walk you through a basic file structure for deploying the Telegraf agent as a daemonset using the Kustomize command line tool. You can manually create each directory and file on your local machine or clone our public repository from the MetricFire GitHub.
Project Directory:
telegraf-daemonset/
├── kustomization.yaml
└── resources/
    ├── config.yaml
    ├── daemonset.yaml
    ├── namespace.yaml
    ├── role.yaml
    ├── role-binding.yaml
    └── service_account.yaml
kustomization.yaml: This file serves as the orchestrator, tying together all the other YAML files and applying any additional configurations or patches. It ensures that the deployment is consistent and repeatable across environments.
apiVersion: kustomize.config.k8s.io/v1beta1
kind: Kustomization

namespace: monitoring

resources:
  - resources/config.yaml
  - resources/daemonset.yaml
  - resources/namespace.yaml
  - resources/role-binding.yaml
  - resources/role.yaml
  - resources/service_account.yaml
resources/config.yaml: This file holds the configuration data required by your DaemonSet or any other Kubernetes resource. For Telegraf, this typically includes the input/output plugins and their respective configurations. In Kubernetes, it is utilized as a ConfigMap to supply configuration data to your DaemonSet. We'll configure the inputs alongside the 'default' performance collection plugins.kubernetes plugin and the outputs.graphite plugin, which will forward data to your Hosted Graphite trial account (be sure to include your HG API key in this file).
apiVersion: v1
kind: ConfigMap
metadata:
  name: telegraf-config
data:
  telegraf.conf: |
    [agent]
      hostname = "$HOSTNAME"
      interval = "10s"
      round_interval = true

    [[inputs.cpu]]
      percpu = false  ## setting to 'false' limits the number of cpu metrics returned

    [[inputs.disk]]
      ignore_fs = ["tmpfs", "devtmpfs", "devfs", "iso9660", "overlay", "aufs", "squashfs"]

    # [[inputs.diskio]]  ## commented out to limit the number of metrics returned

    [[inputs.mem]]

    [[inputs.system]]

    [[outputs.graphite]]
      servers = ["carbon.hostedgraphite.com:2003"]
      prefix = "<YOUR-HG-API-KEY>.telegraf-k8"

    [[inputs.kubernetes]]
      url = "https://$HOSTIP:10250"
      bearer_token = "/var/run/secrets/kubernetes.io/serviceaccount/token"
      insecure_skip_verify = true
resources/daemonset.yaml: This file defines the DaemonSet resource for Kubernetes. A DaemonSet ensures that a copy of a Pod runs on all (or some) nodes in the cluster. It contains specifications for the Pod template, such as the container image, resource limits, and volumes.
apiVersion: apps/v1
kind: DaemonSet
metadata:
  name: telegraf
spec:
  selector:
    matchLabels:
      name: telegraf
  template:
    metadata:
      labels:
        name: telegraf
    spec:
      serviceAccountName: telegraf-sa
      containers:
      - name: telegraf
        image: telegraf:latest
        resources:
          limits:
            memory: 200Mi
            cpu: 200m
          requests:
            memory: 100Mi
            cpu: 100m
        volumeMounts:
        - name: config
          mountPath: /etc/telegraf/telegraf.conf
          subPath: telegraf.conf
        - name: docker-socket
          mountPath: /var/run/docker.sock
        - name: varlibdockercontainers
          mountPath: /var/lib/docker/containers
          readOnly: true
        - name: hostfsro
          mountPath: /hostfs
          readOnly: true
        env:
        # This pulls HOSTNAME from the node, not the pod.
        - name: HOSTNAME
          valueFrom:
            fieldRef:
              fieldPath: spec.nodeName
        # In test clusters where hostnames are resolved in /etc/hosts on each node,
        # the HOSTNAME is not resolvable from inside containers
        # So inject the host IP as well
        - name: HOSTIP
          valueFrom:
            fieldRef:
              fieldPath: status.hostIP
        # Mount the host filesystem and set the appropriate env variables.
        # ref: https://github.com/influxdata/telegraf/blob/master/docs/FAQ.md
        # HOST_PROC is required by the cpu, disk, mem, input plugins
        - name: "HOST_PROC"
          value: "/hostfs/proc"
        # HOST_SYS is required by the diskio plugin
        - name: "HOST_SYS"
          value: "/hostfs/sys"
        - name: "HOST_MOUNT_PREFIX"
          value: "/hostfs"
      volumes:
      - name: hostfsro
        hostPath:
          path: /
      - name: config
        configMap:
          name: telegraf-config
      - name: docker-socket
        hostPath:
          path: /var/run/docker.sock
      - name: varlibdockercontainers
        hostPath:
          path: /var/lib/docker/containers
resources/namespace.yaml: Namespaces are used to logically separate resources in a cluster. This file ensures that all the resources for your DaemonSet are deployed in the specified namespace.
apiVersion: v1
kind: Namespace
metadata:
  name: monitoring
resources/role.yaml: Roles grant access to resources within a namespace. This file specifies what actions can be taken on which resources by the service account used by your DaemonSet.
kind: ClusterRole
apiVersion: rbac.authorization.k8s.io/v1
metadata:
  name: telegraf-cluster-role
rules:
  - apiGroups: ["metrics.k8s.io"]
    resources: ["pods"]
    verbs: ["get", "list", "watch"]
  - apiGroups: [""]
    resources: ["nodes", "nodes/proxy", "nodes/stats", "persistentvolumes"]
    verbs: ["get", "list", "watch"]
resources/role-binding.yaml: This file binds a Role to a user, group, or service account. It allows you to specify who can perform actions on the resources defined in the Role within the specified namespace.
apiVersion: rbac.authorization.k8s.io/v1
kind: ClusterRoleBinding
metadata:
  name: telegraf-sa-binding
subjects:
  - kind: ServiceAccount
    name: telegraf-sa
roleRef:
  apiGroup: rbac.authorization.k8s.io
  kind: ClusterRole
  name: telegraf-cluster-role
resources/service_account.yaml: Service accounts provide an identity for processes that run in a Pod. They are used to authenticate with the Kubernetes API server and are associated with Pods that must interact with the cluster's resources.
apiVersion: v1
kind: ServiceAccount
metadata:
  name: telegraf-sa
Deploying the Telegraf Daemonset
By now, your project directory should contain the `kustomization.yaml` file along with the `resources` directory, which houses the other 6 YAML files.
With the correct cluster context already in use, you can perform a dry run to test and then deploy the `kustomization.yaml` file directly from your root project directory:
- kubectl apply -k . --dry-run=client
- kubectl apply -k .
Expected output:
namespace/monitoring created
serviceaccount/telegraf-sa created
clusterrole.rbac.authorization.k8s.io/telegraf-cluster-role created
clusterrolebinding.rbac.authorization.k8s.io/telegraf-sa-binding created
configmap/telegraf-config created
daemonset.apps/telegraf created
You can now retrieve a list of running DaemonSets in your cluster and verify that one with the name "telegraf" exists within the "monitoring" namespace:
- kubectl get daemonsets --all-namespaces
Telegraf will now begin collecting and forwarding node, pod container, volume, and network activity metrics to your Hosted Graphite trial account. These metrics, sent in the Graphite format, can be utilized in HG to build custom dashboards and set up alerts. For more details and additional configuration options for the `inputs.kubernetes` plugin, refer to the official GitHub repository.
Viewing Metrics with Hosted Graphite
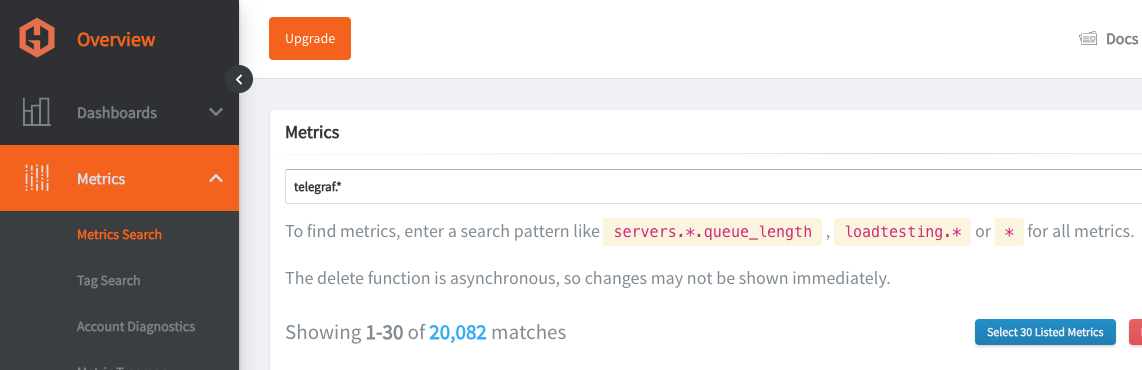
Go to your Hosted Graphite trial account and head to the Metrics Search section. To view a complete list of your Graphite metrics, use "Telegraf" as your search parameter, as all your metrics will be prefixed with it
Plotting the Metrics on Hosted Grafana
For the most exciting part, we will plot these raw metrics data into visualizations that users can understand. We will use Grafana, an open-source web application for interactive data visualization, using charts, graphs, and other data visualization tools. It also provides capabilities to connect to multiple data sources, such as Graphite, Elasticsearch, and MySQL, along with alerting capabilities.
First, log in to Hosted Graphite at https://www.hostedgraphite.com/app and browse to Dashboards -> Grafana to open the Hosted Grafana application page.
Since Hosted Grafana is part of MetricFire’s offering, the data source connection between Grafana and Graphite is automatically made for us.
Grafana comes with many pre-built dashboards as part of its Grafana dashboards library, and MetricFire's support team is happy to install more wherever needed or use the Hosted Graphite Dashboard Library and generate a pre-made Kubernetes Overview dashboard that will be compatible with you telegraf-k8 metrics.
We can also download ready-made dashboards built for Kubernetes instead of creating one from scratch. We will download a pre-built dashboard from the Grafana dashboard library for our use case.
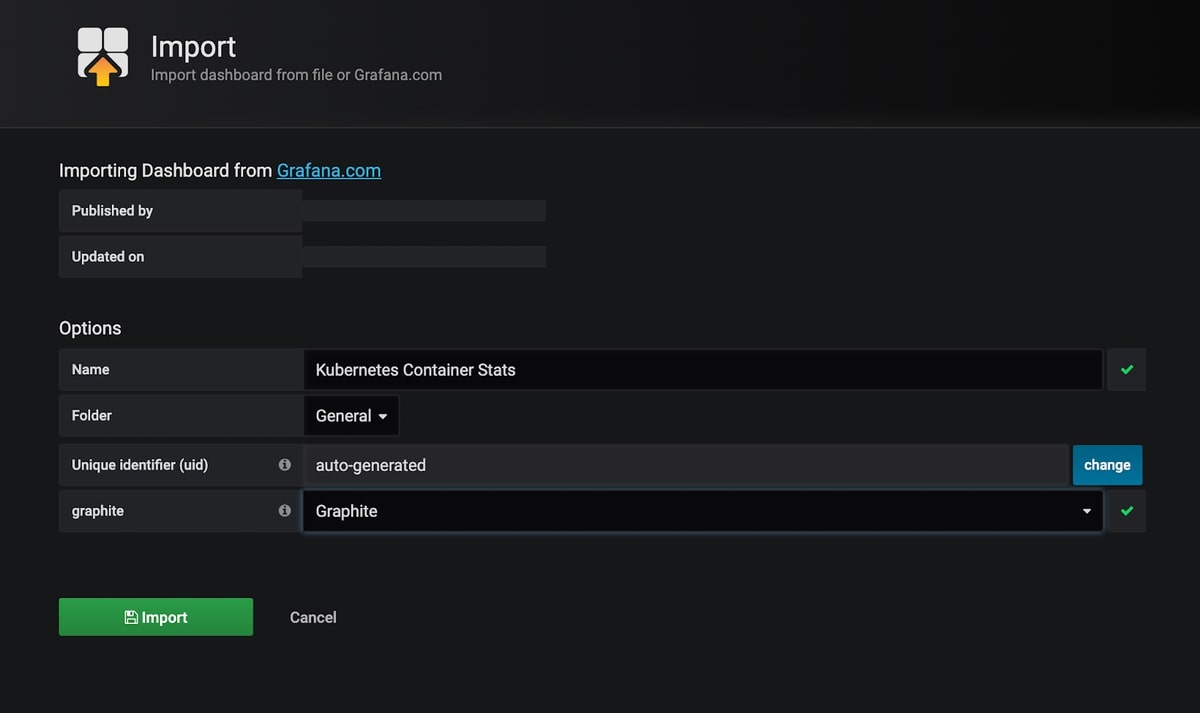
On the Kubernetes Container Stats page, click the link “Download JSON” and import it into the Hosted Grafana portal. Make sure to choose the Graphite data source appropriately.
You can alos navigate to Dashboards => Primary Dashboards, select the + button to create a new panel and use the query UI in Edit mode to select a graphite metric path (in HG, the default data source will be the Hosted Graphite backend). See the HG dashboard docs for more details on creating dashboards and using more advanced features like variables, annotations, and Graphite functions:
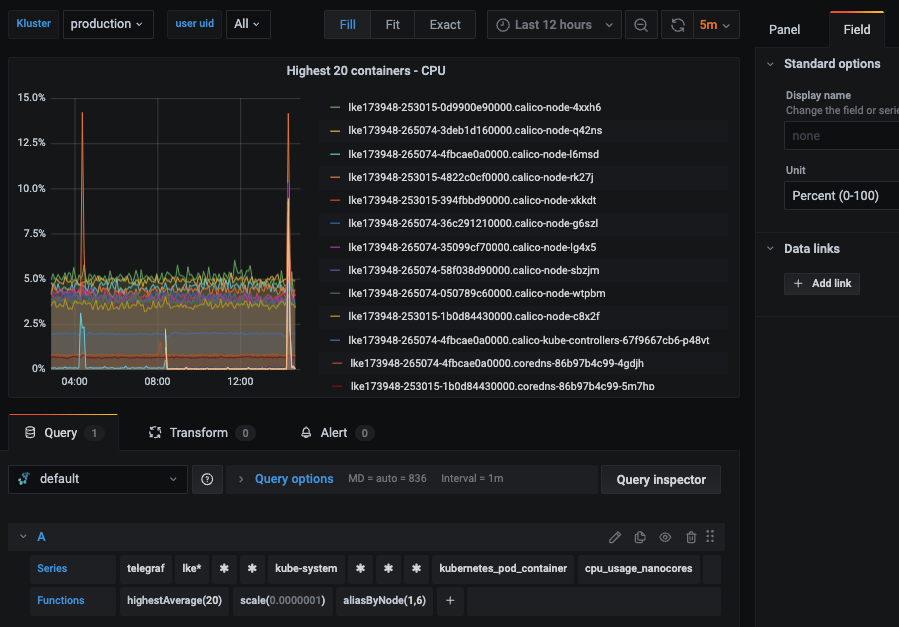
Hosted Grafana is a powerful visualization tool built on top of the open-source Grafana. It allows you to create your own visualizations and set up alerts whenever a metric value crosses a certain threshold.
Check out our article, Grafana Dashboards from Basic to Advanced, to learn how to set up Grafana alerts and build custom dashboards.
You can also create other types of visualizations based on the metrics exposed by Kubernetes. Look at the article Our Favorite Grafana Dashboards to make some of the more advanced dashboards.
Plotting the monitoring visualization on Grafana
Grafana has many pre-built dashboards that you can find on the Grafana dashboards resources site. We are going to utilize one of these dashboards for our Kubernetes monitoring: Kubernetes Container Stats
On the Kubernetes Container Stats page, click the link “Download JSON” and import it into our Grafana portal. Make sure to choose the Graphite data source appropriately.
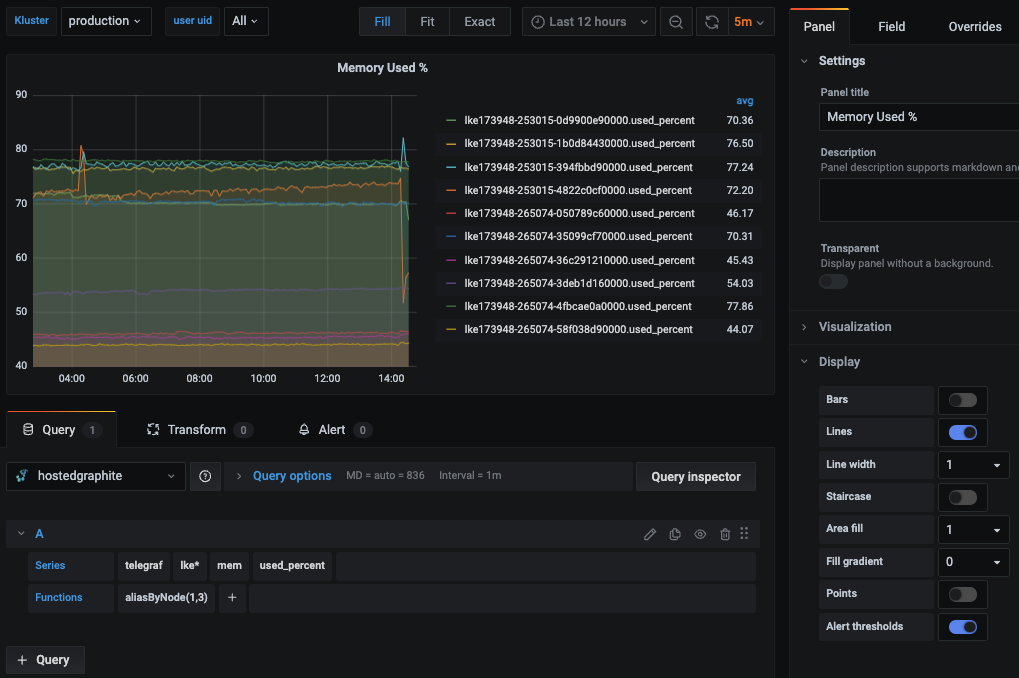
As soon as the dashboard is imported, we should see the metrics being shown in our dashboard, similar to below:
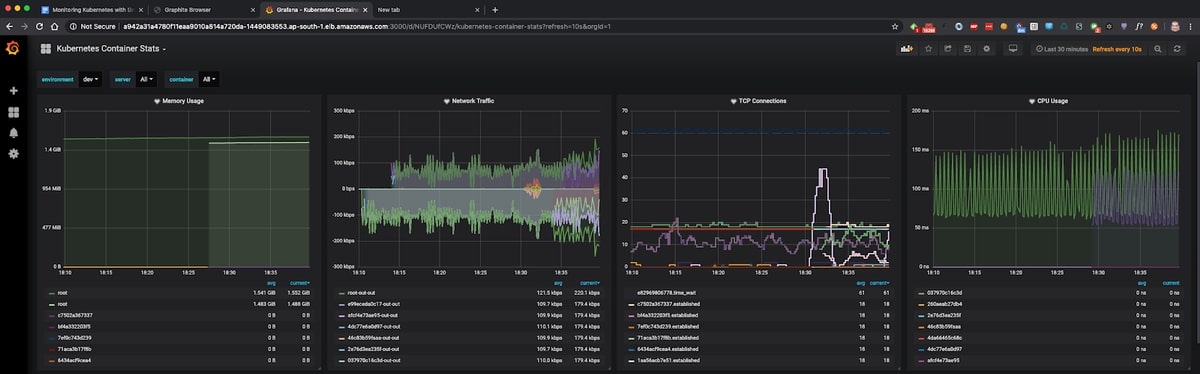
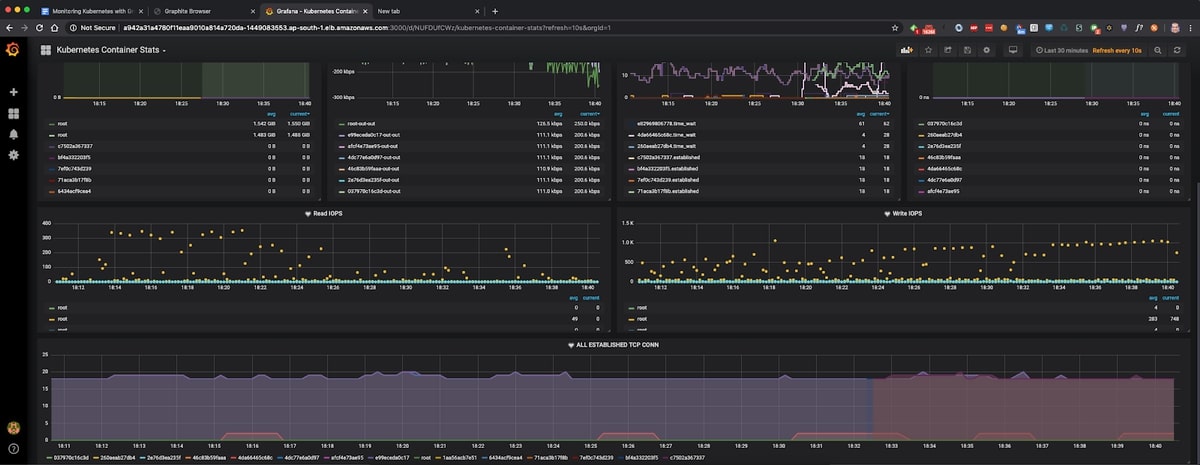
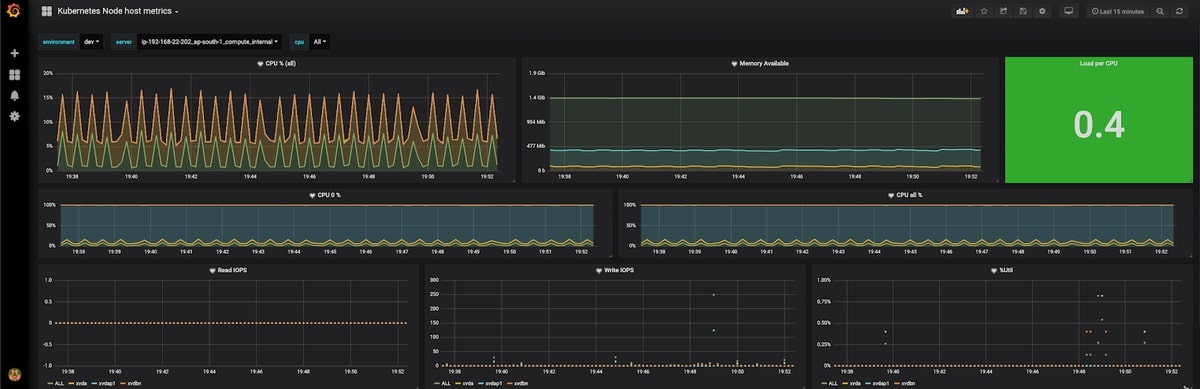
Similarly, there is another dashboard Kubernetes Node host metrics. When this is imported, it will show the metrics per host selected in the dashboard.
If the values in these dashboards exceed a critical threshold, you might want to set up alerts. Check out our article "Grafana Dashboards from Basic to Advanced" to learn how to set up Grafana alerts and build custom dashboards.
You can also create other types of visualizations based on the metrics exposed by Kubernetes. Look at the article Our Favorite Grafana Dashboards to create some of the more advanced dashboards.
Setting up Kubernetes Monitoring using MetricFire
The setup we have done above works for very basic Kubernetes infrastructure, which would contain just a few nodes. In order to handle the production-level load, which would be a few hundred nodes and upwards of a few Mbps network traffic, you would need to scale out both Graphite and Grafana to handle the increasing load.
That’s where Hosted Graphite and Hosted Grafana come into the picture. They allow you to scale for long-term storage and provide redundant data storage without having to go through the arduous process of setting up Graphite and Grafana, as detailed above.
Hosted Graphite and Hosted Grafana through MetricFire allow for the continuous active deployment of new features, as MetricFire’s products all have their foundations in the ever-growing open-source projects. Configuring Telegraf agent as a Daemonset that forwards node/pod metrics to send Kubernetes metrics to your MetricFire account is simple. It just requires configuring your account's API key to be used as the prefix for each metric and the URL Endpoint to be used as the server destination. Check out our article Monitoring Kubernetes with Hosted Graphite to learn how to set up monitoring your Kubernetes infrastructure quickly and easily using our Hosted service.
Sign up for the MetricFire free trial here, and start building Kubernetes dashboards within a few minutes.
Conclusion
In this article, we have seen how to set up Kubernetes monitoring with Graphite and some advanced visualizations for monitoring Kubernetes using Graphite and Grafana.
Sign up here for a free trial of our Hosted Graphite and Grafana. If you have any questions about our products or about how MetricFire can help your company, book a demo and talk to us directly.

