
Table of Contents
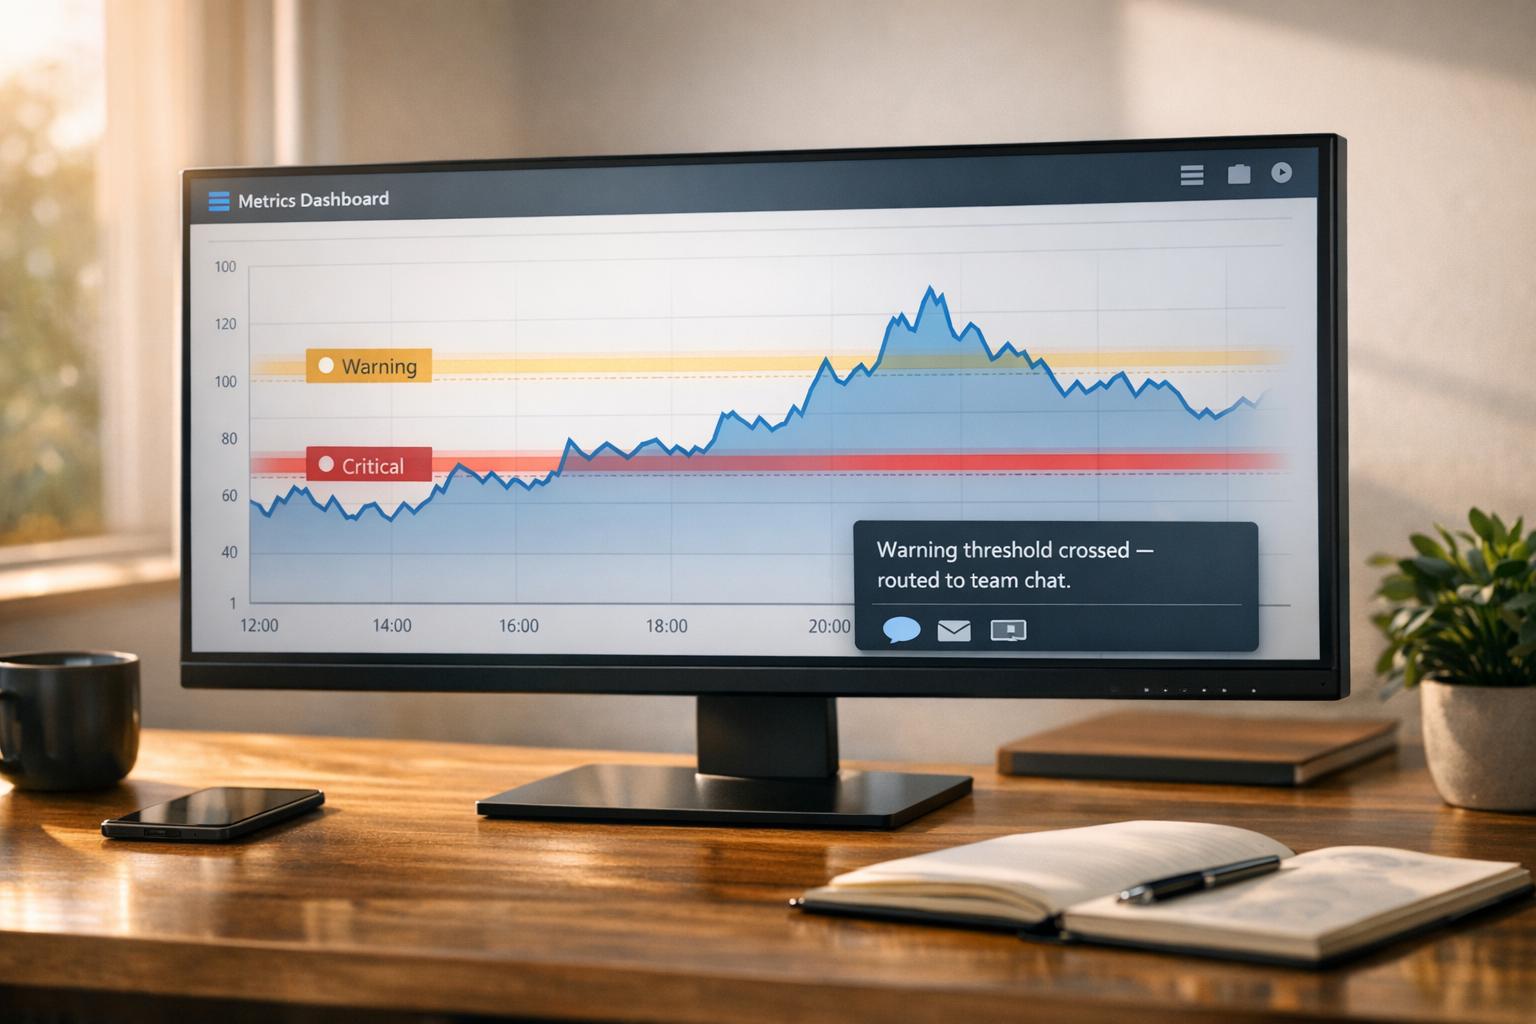
Great systems are not just built. They are monitored.
MetricFire is a managed observability platform that helps teams monitor production systems with clean dashboards and actionable alerts. Delivering signal, not noise. Without the operational burden of self-hosting.
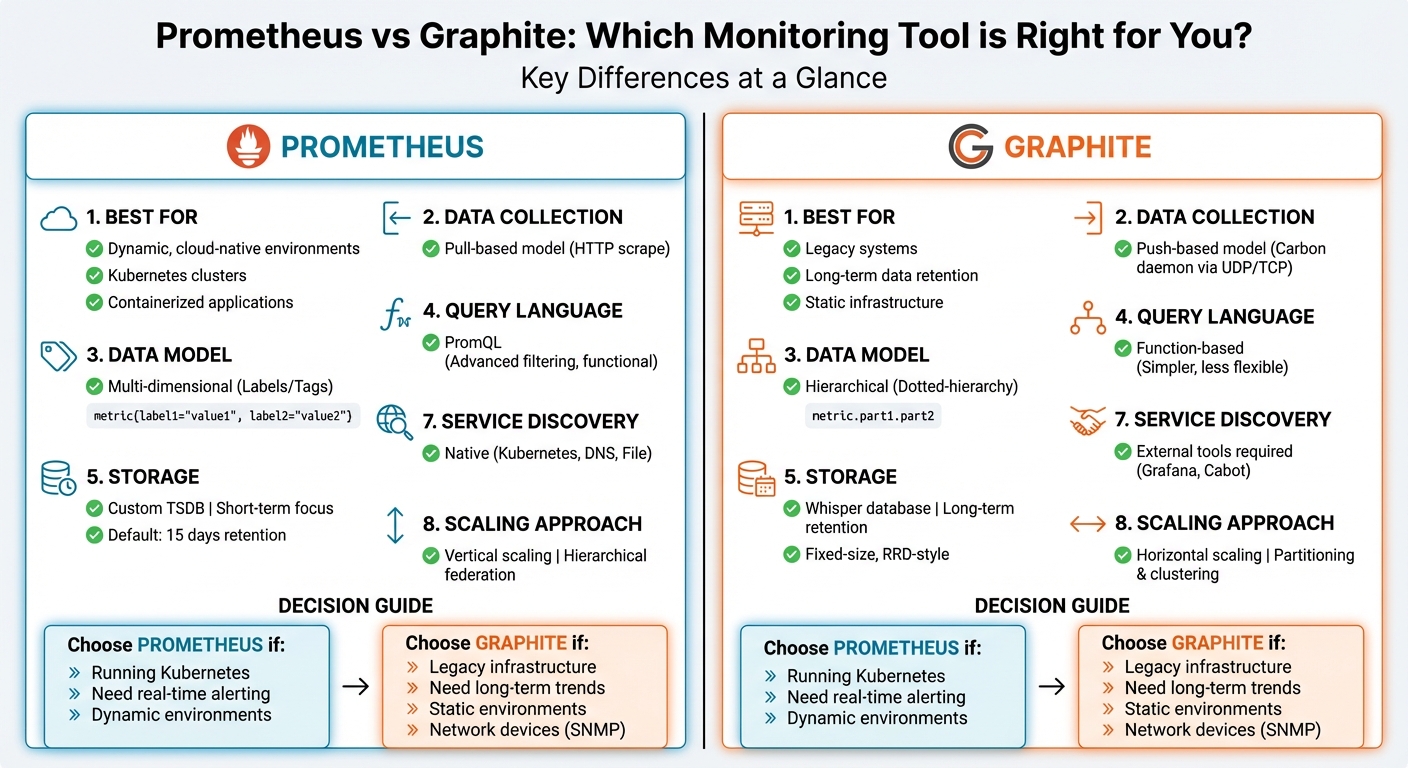
Prometheus vs Graphite: Choosing the Right Monitoring Tool
Looking for the best monitoring tool for your infrastructure? Here's the quick answer:
- Prometheus is ideal for dynamic, cloud-native environments, especially Kubernetes. Its pull-based model, multi-dimensional data, and built-in alerting make it great for real-time monitoring and incident response.
- Graphite works best for legacy systems or setups requiring long-term data retention. Its push-based model and hierarchical data structure suit static environments and straightforward trend analysis.
Key Differences:
- Data Collection: Prometheus uses pull; Graphite uses push.
- Storage: Prometheus focuses on short-term, high-resolution data; Graphite excels in long-term retention.
- Query Language: PromQL offers advanced filtering; Graphite's language is simpler but less flexible.
- Alerting: Prometheus has built-in alerting; Graphite relies on external tools.
- Integration: Prometheus integrates natively with Kubernetes; Graphite requires additional setup.
If you're running modern, containerized workloads, Prometheus is likely your best bet. You can also monitor Prometheus with MetricFire for enhanced visibility. For static, legacy environments, Graphite might be a better fit.
[banner_cta title=“Sign up for a Demo!” text=“Get Hosted Graphite by MetricFire free for 14 days. No credit card required.“]
Prometheus vs Graphite Monitoring Tools Comparison Chart
Architecture: How Prometheus and Graphite Work
The way Prometheus and Graphite are built directly influences how they collect, store, and handle metrics. Knowing these differences can help you decide which tool aligns better with your operational needs.
Pull-Based vs. Push-Based Data Collection
Prometheus uses a pull-based model, meaning the server actively sends HTTP requests to scrape metrics from target endpoints at set intervals. For this to work, your applications or services need to expose a /metrics endpoint or use an exporter to translate metrics into Prometheus's format. If something goes wrong during a scrape, it immediately signals a potential issue with the target's health.
Graphite, on the other hand, follows a push-based model. Its Carbon daemon waits to receive data via UDP or TCP. In this setup, your application or a sidecar agent must push metrics to the Graphite server. While this approach is well-suited for batch jobs or short-lived processes, it has a downside - it can be hard to pinpoint the cause when metrics stop arriving. Is it the application? The network? Or is there just no data to send?
Prometheus's pull model excels in dynamic environments such as Kubernetes, where its built-in service discovery automatically detects new pods and services via the Kubernetes API. Graphite, however, often depends on external agents or static endpoint lists, making it less ideal for rapidly changing setups. That said, Graphite's push model is easier to manage in restricted network environments since applications only need outbound access to send data. Now, let’s explore how these tools handle storage and data retention.
Storage and Data Retention
Prometheus features a custom time series database (TSDB) designed with an append-only structure. It stores data in compacted blocks, making it ideal for short-term, high-resolution monitoring. By default, Prometheus retains data for 15 days, which works well for real-time troubleshooting and alerting.
Graphite uses Whisper, a fixed-size round-robin database. Whisper is great for long-term storage thanks to its roll-up rules. For instance, it can keep data at 1-second resolution for a day, then downsample to 1-minute resolution for a month, and eventually store data at 1-hour resolution for longer periods.
"If you want a clustered solution that can hold historical data long term, Graphite may be a better choice." - Prometheus.io
Prometheus is better suited for irregular data intervals due to its append-only design. Whisper, while efficient for regular intervals, may struggle with sporadic data points. If you're working with Kubernetes or containerized environments that need automatic service discovery, Prometheus is likely the better fit. Meanwhile, Graphite is a solid choice for legacy systems that prioritize straightforward long-term historical analysis.
Feature Comparison: Prometheus vs. Graphite
Query Languages and Flexibility
Prometheus utilizes PromQL, a functional query language that operates on labels and tags. This multidimensional system enables precise filtering and aggregation of metrics. PromQL is particularly strong at handling advanced calculations such as rate changes, percentiles, and histograms, all of which are natively supported.
Graphite, on the other hand, employs function-based queries. These rely on a hierarchical, dotted naming structure, where you can chain or nest functions to manipulate metrics. For example, you might use movingAverage(servers.web01.cpu, 10) to smooth out fluctuations. While this approach works well for straightforward queries, it becomes less effective for multi-dimensional slicing or in-depth statistical tasks.
"Prometheus was made by SREs for SREs which presumes a higher degree of specialized knowledge." - MetricFire
PromQL's advanced filtering capabilities make it ideal for dynamic environments where metrics are tagged with attributes such as environment, region, or service name. However, this flexibility comes with a steeper learning curve. By contrast, Graphite's hierarchical model is more intuitive for newcomers.
Alerting and Integration Options
Prometheus comes with native alerting through its AlertManager component. This feature evaluates rules directly against your metrics, using PromQL to define thresholds. AlertManager supports integrations with popular notification channels like PagerDuty, Slack, email, and webhooks right out of the box. This built-in functionality minimizes reliance on external tools, allowing for faster incident responses.
Graphite lacks built-in alerting, meaning you'll need to rely on external solutions like Grafana, Cabot, or other third-party platforms to set up alerts. While this adds a layer of flexibility - letting you pick a system that aligns with your existing tools - it also requires additional configuration. This complexity is a key factor when considering how hard it is to run your own Graphite instance. If you're already using Grafana for visualizations, integrating its alerting features can be a straightforward option.
Prometheus has a standalone architecture, ensuring reliability even during outages, as each server operates independently and does not depend on external storage. Graphite's push-based model, on the other hand, works seamlessly with agents like collectd, Telegraf, and StatsD, offering broad compatibility across various platforms and programming languages.
These differences underscore the distinct operational philosophies of the two systems, as summarized in the table below.
Feature Comparison Table
| Feature | Prometheus | Graphite |
|---|---|---|
| Query Language | PromQL (Functional, Label-based) | Graphite Functions (Chained/Nested) |
| Data Model | Multi-dimensional (Labels/Tags) | Hierarchical (Dotted-hierarchy) |
| Data Collection | Pull (via HTTP scrape) | Push (via Carbon daemons) |
| Alerting | Native (AlertManager) | External (Grafana, Cabot, etc.) |
| Visualization | Expression Browser & Grafana | Graphite Web UI & Grafana |
| Storage | Local disk (Short-term default) | Whisper (Fixed-size, RRD-style) |
| Service Discovery | Native (K8s, DNS, File) | Manual or via Relays |
| Client Support | client libraries, Exporters | Agents (collectd, Telegraf, StatsD) |
| Default Retention | 15 Days | Fixed (Configurable via Whisper) |
Ready to dive in? Sign up for a free trial and start monitoring your infrastructure today. Or book a demo to discuss your specific needs with the MetricFire team.
Scalability and Deployment
Scaling Strategies
Prometheus and Graphite approach scaling in distinct ways, tailored to different needs and infrastructures. Prometheus relies on vertical scaling or a hierarchical federation model. This means you can either scale a single node or set up a hierarchy of Prometheus servers, where subordinate servers collect metrics and a central server aggregates them. This setup is particularly useful for organizations with distributed data centers or operations across multiple regions.
On the other hand, Graphite uses horizontal scaling through partitioning and clustering, supported by consistent hashing. Its modular structure - comprising Carbon, Whisper, and Graphite-web - spreads the workload across multiple nodes. The Whisper database, with its fixed-size, file-based format, simplifies data retention and aggregation by automatically handling these processes.
For long-term storage or handling of heavy query loads, Prometheus often integrates with external systems such as Thanos or Cortex. However, self-managed deployments come with operational costs, including hardware, storage, and the time engineers spend on maintenance and configuration. These scaling methods are essential when monitoring Kubernetes and other cloud-native platforms, as explained in the next section.
Kubernetes and Cloud Integration
Prometheus stands out with its cloud-native design, featuring native Kubernetes integration. It supports automatic service discovery and Kubernetes Operator, making it ideal for dynamic containerized environments. Moreover, Prometheus operates as a single, self-contained binary, simplifying deployment and management.
"Prometheus is designed for reliability, to be the system you go to during an outage to allow you to quickly diagnose problems."
- Prometheus.io
In contrast, Graphite does not offer native Kubernetes integration. Deploying Graphite in Kubernetes typically requires manual setups, such as container deployments or system services. To collect metrics from Kubernetes applications, you’ll need tools like StatsD daemons or agents such as collectd, Telegraf, or Diamond.
"Graphite doesn't provide native Kubernetes integration like Prometheus does. However, you can use a StatsD daemon (like statsd-exporter) as a bridge between your applications running on Kubernetes and Graphite."
- Prathamesh Sonpatki, Last9
How to Choose Between Prometheus and Graphite
When to Use Each Tool
Prometheus shines in dynamic, cloud-native environments. Its pull-based model and built-in service discovery make it an excellent option for Kubernetes clusters and containerized applications. Plus, its real-time Alertmanager ensures quick responses to incidents.
On the other hand, Graphite is better suited to legacy systems or setups that require long-term trend analysis. Its push-based model and hierarchical data structure are ideal for collecting metrics from traditional infrastructure and SNMP network devices. As the documentation explains:
"Graphite focuses on being a passive time series database with a query language and graphing features. Any other concerns are addressed by external components."
These fundamental differences play a significant role in determining which tool best fits your monitoring needs.
Decision Factors
The choice between Prometheus and Graphite often comes down to a few critical considerations.
- Infrastructure Type: If you're running Kubernetes or frequently scaling containerized workloads, Prometheus's native integration can simplify monitoring. For static environments or setups involving network devices, Graphite's compatibility might be more advantageous.
- Data Retention: Prometheus is designed for short-term data retention, typically covering days or weeks. It prioritizes system reliability, even if that means some data might be incomplete during failures. Graphite, with its Whisper database, supports long-term storage of historical data, making it a better fit for use cases such as billing or compliance.
- Team Expertise: PromQL, Prometheus's query language, is powerful but has a steeper learning curve, which might challenge teams unfamiliar with multi-dimensional queries. Graphite's simpler query language could be easier for teams new to monitoring. Additionally, Prometheus includes built-in alerting via Alertmanager, whereas Graphite requires external tools such as Cabot or Grafana for alerts.
If you're considering a hosted platform to simplify monitoring, MetricFire offers solutions built on Graphite and Grafana. You can book a demo to explore how their platform can meet your needs.
Conclusion
When choosing between Prometheus and Graphite, consider your infrastructure, data retention needs, and operational objectives. Prometheus shines in cloud-native setups, especially with Kubernetes and containerized environments. Its multi-dimensional data model, PromQL query language, and built-in Alertmanager make it ideal for dynamic, modern systems. As highlighted in our comparison, Prometheus's design is tailored to these environments, ensuring reliability during outages and incident response.
On the other hand, Graphite is a strong choice for legacy systems that prioritize long-term trend analysis. Its push-based architecture and hierarchical data model are well-suited for traditional infrastructure and network devices. While it doesn't include native alerting, its simplicity and proven reliability since 2008 make it a dependable option for specific use cases. These differences underscore the unique strengths of each tool.
Your decision should factor in team expertise, scalability requirements, and whether your focus is on short-term incident management or long-term data trends. Both tools are open-source and free, so the true cost lies in operational overhead and integration challenges.
For those looking to simplify infrastructure management, MetricFire offers managed Graphite and Grafana services, allowing you to focus on gaining insights.
Ready to get started? Sign up for a free trial here or book a demo here to discuss your monitoring needs with the MetricFire team.
FAQs
Can Prometheus be used for long-term retention?
Prometheus can handle long-term data retention when combined with external storage systems. Its built-in local storage is designed for short-term use, but by integrating with tools like Thanos, Cortex, or Mimir, you can scale its storage capabilities. These integrations allow Prometheus to efficiently manage and retain metrics data over extended periods, ensuring scalability and durability for your monitoring needs.
What’s hardest about moving from Graphite to Prometheus?
Transitioning from Graphite to Prometheus presents its own challenges, largely due to differences in how the systems are designed and operate. Prometheus uses a pull-based model, which means you’ll need to set up scrape jobs and configure discovery mechanisms. This can get tricky, especially in dynamic environments like Kubernetes, where services and instances are constantly shifting.
Another adjustment involves Prometheus's key-value label system. If you're used to Graphite's simpler metric hierarchy, you may need to rethink and reorganize your metric structures to fit Prometheus’s approach.
Finally, long-term storage can be a sticking point. Prometheus is primarily designed for short- to medium-term data retention, whereas Graphite offers more straightforward options for longer-term data retention. This difference might require additional tools or configurations if long-term storage is a priority for your use case.
Do I need Grafana with either tool?
Grafana isn’t a necessity if you’re using Prometheus or Graphite. While Grafana is a standalone visualization tool that integrates seamlessly with both systems to create dashboards, it’s entirely optional and doesn’t impact their core functionality.
Sign up for the free trial and begin monitoring your infrastructure today. You can also book a demo and talk to the MetricFire team directly about your monitoring needs.