
Table of Contents
Great systems are not just built. They are monitored.
MetricFire runs Graphite and Grafana as a fully managed service for small engineering teams, taking care of storage, scaling, and version updates so your team doesn't have to. Plans start at $19/month, billed per metric namespace rather than per host, and include engineer-staffed support. Integrations work natively with Heroku, AWS, Azure, and GCP, and data is stored with 3× redundancy in SOC2- and ISO:27001-certified data centres.
Monitoring MySQL query performance is less about connecting a database to Grafana and more about understanding how queries behave over time. In practice, effective query monitoring relies on two types of data. Metrics show trends such as query rate, latency, and resource usage. Logs and query analysis tools show exactly which queries are slow and why.
Grafana sits on top of this stack as a visualization layer. It helps combine metrics from collectors such as Telegraf/OpenTelemetry or Alloy/Promtail with insights from query logs, making it easier to detect issues and investigate them.
In this guide, we focus on how to monitor MySQL queries in a way that is both practical and production safe.
Choosing the Right Approach for MySQL Query Monitoring
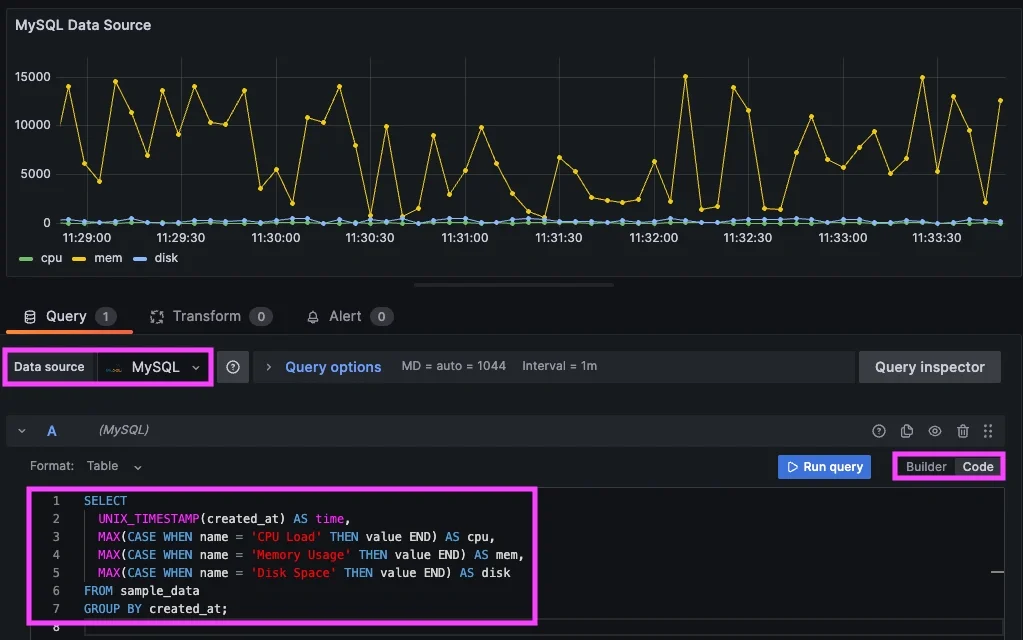
There are several ways to monitor MySQL with Grafana, but not all of them are suitable for query performance monitoring. Connecting MySQL directly as a Grafana data source can be useful for running queries and building simple dashboards. However, it is not designed for continuous monitoring and can add unnecessary load to production systems.
A more reliable approach is to separate data collection from visualization:
- Metrics can be collected using agents such as Telegraf or an exporter
- MySQL logs provide query level details from the performance schema.
This separation allows you to monitor trends without impacting the database, while still having access to detailed query information when needed.
Preparing MySQL for Monitoring
Monitoring MySQL query performance requires access to both metrics and query level data, but this should always be done in a way that avoids impacting production systems or exposing sensitive data.
For metrics collection, tools such as Telegraf or exporters typically connect to MySQL using a dedicated read only user. This user should have only the permissions required to collect performance data, rather than full administrative access. In most cases, this means granting read access to system schemas such as performance_schema and information_schema, along with limited global privileges needed for monitoring. For example, you can create a monitoring user like this:
CREATE USER 'monitor'@'%' IDENTIFIED BY 'strong_password';

GRANT SELECT ON *.* TO 'monitor'@'%';
GRANT PROCESS, REPLICATION CLIENT ON *.* TO 'monitor'@'%';

FLUSH PRIVILEGES;
This allows the monitoring agent to read query and performance data without modifying any tables or executing administrative actions.
For query level visibility, you should also enable either the slow query log or the performance schema. The slow query log captures queries that exceed a defined execution time, while the performance schema provides structured data about query execution, waits, and resource usage. It is important to configure these features carefully. Logging every query can create unnecessary overhead, so most production systems use thresholds to capture only slow or problematic queries.
Finally, ensure that monitoring connections use secure network settings and do not run expensive queries too frequently. The goal is to observe database behavior with minimal impact on performance.
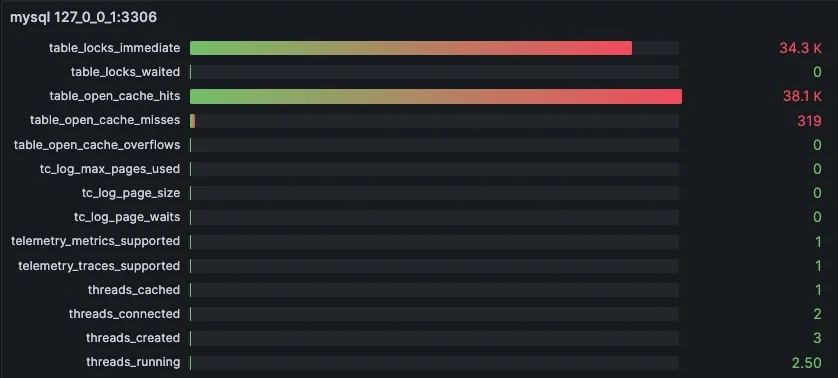
What to Monitor for MySQL Query Performance
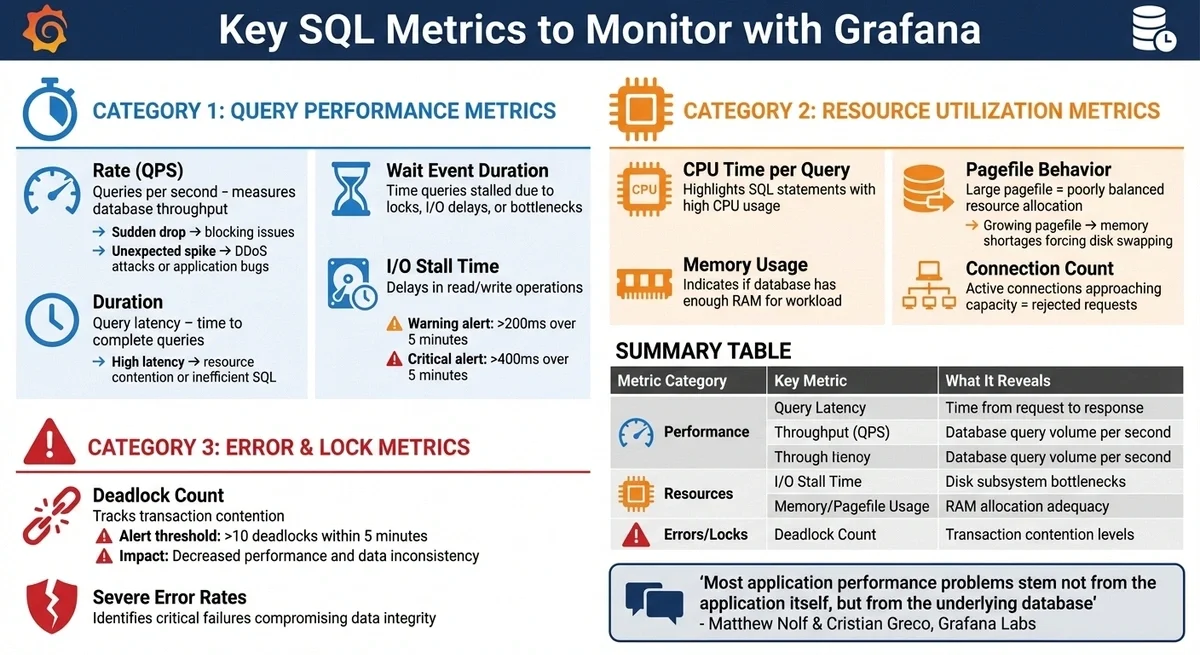
To monitor MySQL effectively, focus on a few key signals around query performance and resource usage:
- Query latency shows how long queries take to execute and is often the first indicator of a problem
- Query rate helps identify sudden spikes or drops in activity
- Error rates can point to failed queries or connection issue
- Resource metrics such as CPU usage, memory pressure, and disk I O help explain why queries are slow
- Locking and deadlocks are also important because they can cause delays even when queries are efficient
Building Dashboards for Query Monitoring
Dashboards are most useful when they help you move quickly from detection to investigation. For MySQL query monitoring, this means focusing on a small set of panels that show both query behavior and system impact in one place. Start with high level signals such as query latency, query rate, and error rates. These make it easy to spot when something changes. A sudden increase in latency or drop in throughput is often the first sign of a problem.
From there, include more detailed views that help explain what is happening. This can include slow query counts, top queries by execution time, or query patterns grouped over time. These views help narrow down which queries are contributing to performance issues.
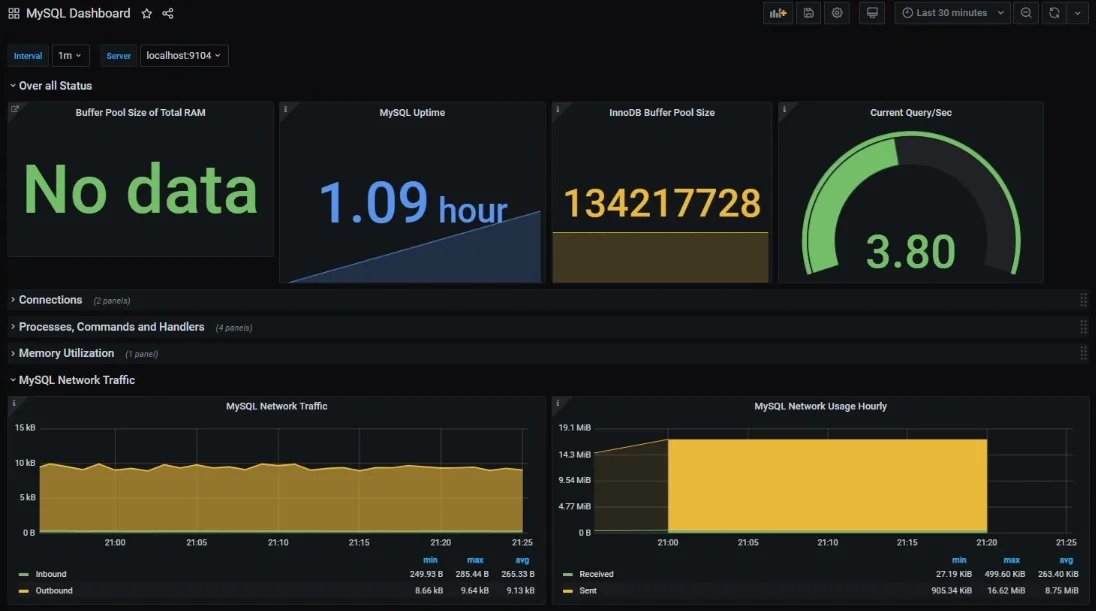
It is also important to include system level metrics such as CPU usage, memory pressure, and disk I O alongside query metrics. Query performance issues are often caused by resource constraints rather than the query itself, so having both perspectives in the same dashboard is critical. A well designed dashboard should allow you to answer two questions quickly. What changed, and what caused it.
For more ways to optimize your MySQL query monitoring with Hosted Grafana, book a demo with MetricFire.
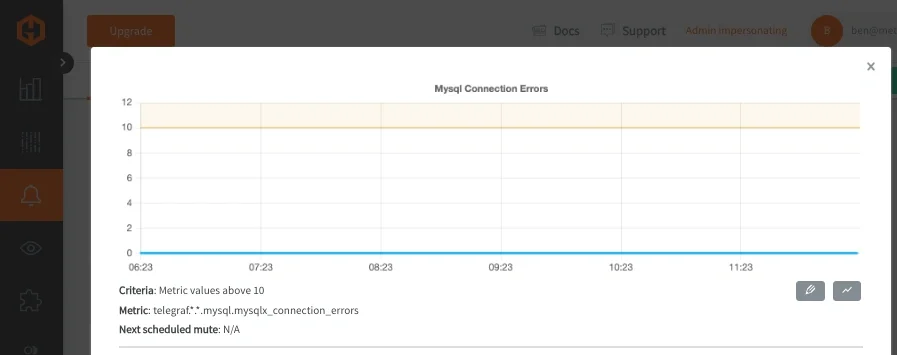
Setting Up Alerts for Query Performance
Dashboards help you understand what is happening, but alerts help you respond when something goes wrong. For MySQL query monitoring, alerts should focus on a few meaningful signals. Query latency is usually the most important, since increases often indicate slow queries or resource contention. Query rate can help identify traffic spikes or drops, while error rates can reveal failing queries or connection issues.
It is important to avoid triggering alerts on short lived spikes. Adding a short evaluation window ensures that alerts only fire when an issue persists, which helps reduce noise and alert fatigue. Alerts should also include enough context to act quickly. This might include a link to the relevant dashboard or query logs so that responders can immediately investigate the issue.
In general, alerts should guide you to the problem and not overwhelm you with data. If an alert does not lead to a clear action, it is probably better handled as a dashboard metric instead.
Using MetricFire for MySQL Query Monitoring
Monitoring MySQL query performance usually requires combining metrics and logs, and managing that stack yourself can add operational overhead. MetricFire simplifies this by providing a hosted environment for both.
For metrics, you can use agents such as Telegraf or OpenTelemetry Contrib to collect database and system metrics and send them to Hosted Graphite. This includes signals like query rate, latency, connections, and resource usage. These metrics can then be visualized in Grafana dashboards to track trends and detect issues early.
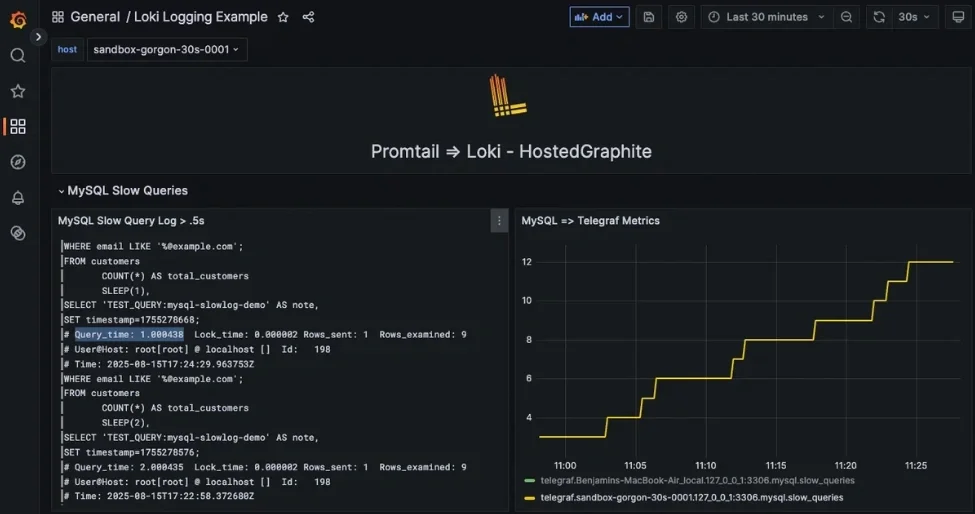
For deeper analysis, MySQL logs can be collected and forwarded using tools such as Promtail into Hosted Loki. This allows you to capture slow queries and query patterns, then explore them alongside your metrics in Grafana.By combining these two layers, you can move quickly from detection to investigation. A spike in latency can be identified in a dashboard, then traced back to specific queries using log data without switching tools or rebuilding context. Because MetricFire provides a Hosted Grafana environment, you can focus on analyzing database performance instead of managing monitoring infrastructure. This makes it easier to scale your monitoring setup as your database workload grows.
Conclusion
Monitoring MySQL query performance is not just about collecting data, it is about understanding how queries behave under real workload conditions and being able to respond when something changes.
In practice, this requires combining multiple layers. Metrics provide a high level view of query performance, showing trends in latency, throughput, and resource usage. Logs and query level data provide the detail needed to identify exactly which queries are causing issues and why. Grafana brings these layers together, making it easier to move from detection to investigation without switching tools.
The most effective setups avoid placing additional load on the database by separating data collection from visualization. Agents and exporters collect metrics safely, while logs capture detailed query behavior - so his approach gives you continuous visibility without impacting production performance.
There is no single dashboard or alert that solves query monitoring on its own. Instead, the goal is to build a system that helps you answer two questions quickly by knowing what changed, and what caused it. By focusing on the right signals and combining metrics with query level insights, teams can identify slow queries earlier, reduce performance issues, and maintain a more reliable database over time.
FAQs
How should I monitor MySQL queries in production?
The most effective approach combines metrics and logs. Metrics show trends such as latency and throughput, while logs or performance schema data reveal the exact queries causing issues. This allows teams to detect problems early and then investigate them using detailed query data.
Source: https://dev.mysql.com/doc/refman/8.0/en/slow-query-log.html
Is it safe to use MySQL as a Grafana data source?
It can be used for dashboards and exploration, but it should not be relied on for continuous monitoring in production. Frequent queries from Grafana can add load to the database, especially under heavy usage. For production monitoring, it is better to collect metrics externally and visualize them in Grafana.
Source: https://grafana.com/docs/grafana/latest/datasources/mysql/
What is the difference between query metrics and query logs?
Query metrics provide aggregated information such as average latency, throughput, and error rates. These are useful for dashboards and alerts. Query logs provide detailed records of individual queries, including execution time and structure. These are essential for debugging and optimization. Using both together gives a complete view of database performance.
Source: https://dev.mysql.com/doc/refman/8.0/en/performance-schema.html
Sign up for the free trial and begin monitoring your infrastructure today. You can also book a demo to speak with the MetricFire team directly about your monitoring needs.

