
Table of Contents
Great systems are not just built. They are monitored.
MetricFire runs Graphite and Grafana as a fully managed service for small engineering teams, taking care of storage, scaling, and version updates so your team doesn't have to. Plans start at $19/month, billed per metric namespace rather than per host, and include engineer-staffed support. Integrations work natively with Heroku, AWS, Azure, and GCP, and data is stored with 3× redundancy in SOC2- and ISO:27001-certified data centres.
Getting Started with Grafana: A Complete Guide
Grafana is a powerful tool for visualizing and monitoring data from various sources like Prometheus, AWS, or SQL databases. It simplifies IT infrastructure monitoring by consolidating metrics, logs, and traces into interactive dashboards. Whether you're managing a small server setup or a large cloud environment, Grafana offers flexibility, ease of use, and robust features for creating dashboards, setting alerts, and optimizing performance.
Key takeaways:
- Installation: Grafana runs on Windows, Linux, and macOS with minimal hardware requirements (512 MB RAM, 1 CPU core). Use package managers (e.g., Homebrew, APT) or manual methods for setup.
- Connecting Data Sources: Supports Prometheus, InfluxDB, AWS CloudWatch, and more. Configure URLs, authentication, and TLS for secure connections.
- Dashboards: Build and customize panels to visualize data. Use variables, thresholds, and templates for dynamic, organized layouts.
- Alerts: Automatically monitor metrics with conditions, thresholds, and notification channels like Slack or email.
- Best Practices: Optimize queries, secure access, and organize dashboards for efficiency and usability.
Grafana is free and open-source but also offers enterprise and cloud-hosted options for scaling your setup. Start small, connect your data, and gradually expand your dashboards to suit your team's needs.
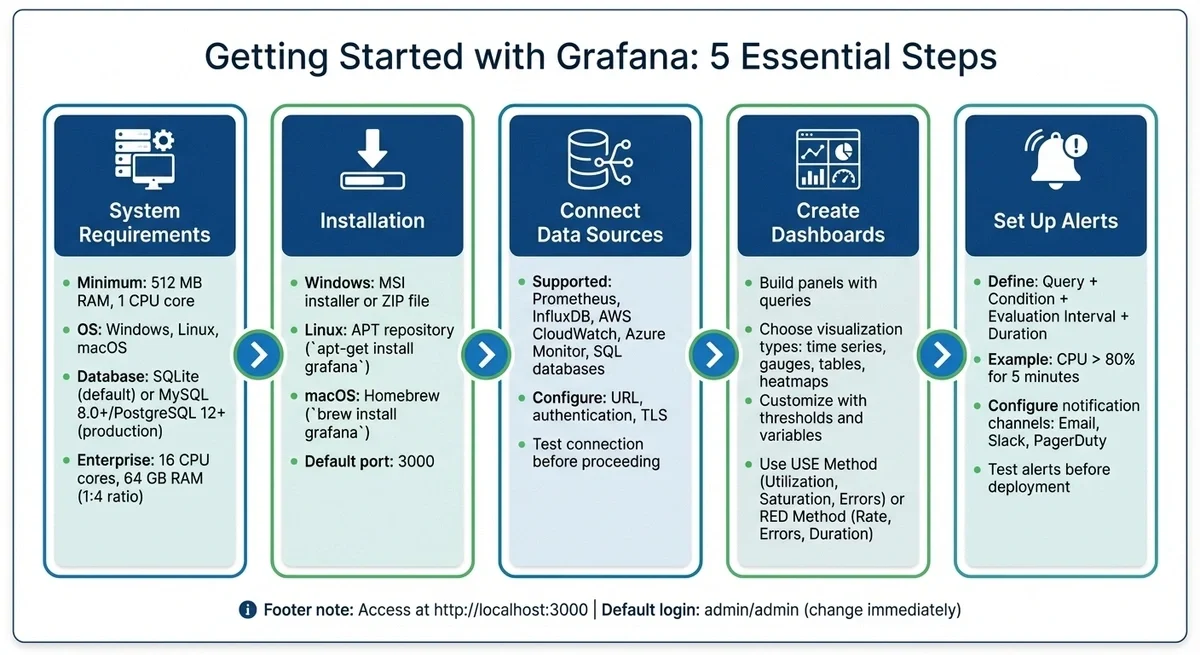
Grafana Setup and Configuration: 5-Step Quick Start Guide
System Requirements and Prerequisites
Grafana can operate on relatively modest hardware - requiring just 512 MB of RAM and a single CPU core - making it a good fit for smaller deployments. However, if you plan to use features such as server-side image rendering, extensive alerting, or heavy data proxying, you'll need more CPU and memory to keep things running smoothly.
On the software side, Grafana is compatible with several operating systems, including Debian, Ubuntu, RHEL, Fedora, SUSE, openSUSE, macOS, and Windows. For the best experience, use a modern browser with JavaScript enabled, such as the latest versions of Chrome, Firefox, Safari, or Microsoft Edge. Keep in mind that Internet Explorer is no longer supported by newer Grafana versions.
Another key consideration is your database setup, especially in production environments. Grafana relies on a backend database to store critical data like user accounts, dashboards, and data sources. While SQLite 3 is the default option, it's not ideal for large-scale or high-availability setups. For these scenarios, opt for MySQL 8.0+ or PostgreSQL 12+. Be aware of a known bug (#15865) that affects PostgreSQL versions 10.9, 11.4, and 12-beta2, which could cause compatibility issues.
For enterprise environments with high demands, plan your resources carefully. A good rule of thumb is to allocate CPU and memory at a 1:4 ratio - for example, 16 CPU cores paired with 64 GB of RAM. Additionally, ensure your network supports 10 Gbps or higher and use fast SSDs with provisioned IOPS to efficiently manage write-ahead logs and data flushing. If you're running Grafana in Docker or Kubernetes, avoid setting memory limits too low. Otherwise, the out-of-memory (OOM) killer might terminate the process, even if the host system still has available RAM.
Installing Grafana
Getting Grafana up and running is straightforward, regardless of the operating system you're using.
Installation on Windows
Windows users can choose between two options: the MSI installer or a standalone ZIP file. The MSI installer is the easiest route. Just download it from the Grafana website, run the installer, and follow the prompts. It handles all the setup for you.
If you want more control, the ZIP file is a good alternative. After downloading, unblock the file to bypass Windows security restrictions, extract the contents to your desired folder, and navigate to the bin directory. From there, run grafana-server.exe to start the server.
By default, Grafana runs on port 3000, which might need elevated permissions. If that’s an issue, switch to port 8080. To do this, copy the sample.ini file to custom.ini (in the configuration folder), then edit the http_port setting. Always use custom.ini for changes - never modify defaults.ini directly.
Want Grafana to run as a Windows service that starts automatically? Use the Non-Sucking Service Manager (NSSM). Keep in mind that setting up or modifying services requires Administrator privileges.
Installation on Linux (Ubuntu/Debian)
For Ubuntu and Debian systems, the official Grafana APT repository is the best way to go. This ensures you get updates automatically. Add the repository, import its GPG key, and install Grafana with:
sudo apt-get install grafana
Make sure you’ve installed dependencies like apt-transport-https, software-properties-common, wget, adduser, and libfontconfig1.
If you prefer, you can download the .deb package directly and install it offline using:
sudo dpkg -i <package_name>.deb
This is especially handy if you need a specific version or lack internet access during installation.
Once installed, you’ll find the configuration file at /etc/grafana/grafana.ini, logs in /var/log/grafana, and the binary at /usr/sbin/grafana-server. Start Grafana with:
sudo systemctl start grafana-server
To make sure it starts automatically after a reboot, run:
sudo systemctl enable grafana-server
For those using RPM-based distributions and needing server-side image rendering (like for alerts), install the necessary fonts with:
sudo yum install fontconfig freetype* urw-fonts
.
Installation on macOS
On macOS, Homebrew simplifies the process. Start by updating Homebrew with brew update, then install Grafana:
brew install grafana
To start the service, use:
brew services start grafana
Where Grafana is installed depends on your Mac’s processor. On Intel-based Macs, it’ll be in /usr/local/Cellar/grafana, while Apple Silicon Macs use /opt/homebrew/Cellar/grafana.
Alternatively, you can download the .tar.gz file from the Grafana website. Extract it to your chosen directory, then run:
./bin/grafana-server
in the terminal.
Accessing Grafana
After installation on any platform, open your browser and go to http://localhost:3000. Log in with the default credentials (admin/admin). On your first login, you’ll be asked to set a new password.
Getting Started with Grafana
Accessing the Grafana Web Interface
Once your Grafana server is up and running, open a modern browser like Chrome, Firefox, Safari, or Edge. Then, head to http://localhost:3000 - unless you’ve changed the default port during setup.
You’ll land on the login screen, where you’ll need to enter your credentials. For a new installation, use admin as both the username and password. After logging in for the first time, Grafana will prompt you to set a new password. It’s crucial to update these default credentials right away to enhance security. Once that’s done, you’re ready to explore Grafana’s monitoring capabilities.
If the interface doesn’t load, check the [server] section in your grafana.ini file. Pay attention to the root_url and http_port settings, and ensure JavaScript is enabled in your browser.
Understanding the Interface
After logging in, you’ll see the Grafana home screen, which is designed for easy navigation. On the left, the side menu gives you access to key features like Dashboards (collections of visualization panels), Explore (for ad-hoc data analysis), Alerting (to set up notifications based on thresholds), and Administration (for user management, data sources, and plugins). The + icon in the menu is your shortcut to creating new dashboards, folders, or importing existing setups.
Grafana’s dashboards are made up of panels, each displaying a specific visualization - whether it’s a graph, table, or metric. To customize these panels, use the panel editor. In the Query tab, you’ll select your data source and write queries to fetch the data you want to display.
If you’re just starting out, try using the built-in -- Grafana -- data source. It generates "Random Walk" test data, allowing you to practice setting up panels without connecting to an external database.
Connecting Data Sources
Grafana shines by integrating data from multiple sources and presenting it in a single, unified view. To start tracking your infrastructure, you’ll need to connect at least one data source. Only users with the Organization Administrator role have the ability to add or remove data sources.
Adding a Data Source
Grafana supports many built-in data sources, such as Prometheus, Graphite, InfluxDB, AWS CloudWatch, Azure Monitor, and several SQL databases. To add one, go to the Connections menu on the left side, select Data sources, and click Add new data source. You’ll see a list of supported options - pick the one that fits your setup.
After selecting the data source type, you’ll need to fill in the configuration details. The URL field is crucial because it specifies where Grafana should find your data source. For example, if you’re running Prometheus locally, use http://localhost:9090. If Grafana and the data source are in separate Docker containers, you’ll need to use the container’s IP or hostname, such as http://host.docker.internal:PORT, instead of localhost.
You can also configure options like Basic Auth, TLS Client Auth, or Forward OAuth identity as needed. For production setups, enabling TLS and uploading CA certificates is a best practice for securing the connection between Grafana and your data source.
To make it easier to manage multiple data sources, give each a clear, descriptive name (e.g., "Production-Prometheus-US-East"). If you want this source to be the default for new panels, toggle the Default option.
Testing Data Source Connections
Once you’ve entered all the connection details, scroll down and click Save & test to check if Grafana can successfully communicate with your data source. If everything is set up correctly, you’ll see a success message like "Successfully queried the Prometheus API (see our guide on monitoring Prometheus)".
If the connection test fails, double-check the URL, authentication settings, and network configurations. For Prometheus specifically, remember that the default scrape and evaluation interval is 15 seconds, the query timeout is 60 seconds, and the series limit is 40,000. If you’re dealing with a large Prometheus instance, enable Disable metrics lookup to improve performance by turning off autocomplete and metrics chooser features.
Once the connection is verified, you can use the Explore feature to run manual queries and verify that the data displays correctly. This step ensures everything is working before you start building dashboards.
If you run into challenges, consider scheduling a demo with the MetricFire team to discuss your monitoring needs.
Creating Dashboards and Panels
Once your data sources are connected, it's time to start building dashboards that help visualize your infrastructure metrics. These dashboards serve as the backbone for advanced features like alerts and performance tuning, which will come into play later.
Building a Dashboard
To get started, head to the main menu, click Dashboards, then choose New followed by New Dashboard. From there, click + Add visualization to open the panel editor - this is where you’ll decide what data to display and how to present it.
Select your data source from the dropdown menu (e.g., Prometheus or InfluxDB). For a deep dive into the former, check out this guide on monitoring with Prometheus. Each panel requires at least one query to fetch data. For example, if you want to display the request rate over a five-minute interval using Prometheus, you’d use the query rate(http_requests_total[5m]).
Once your query is set, pick a visualization type. Grafana offers a variety of options, including time-series graphs, bar charts, gauges, heatmaps, tables, and 3D charts. The preview updates automatically, letting you see how your data looks in each format. For tracking CPU usage over time, a time series graph is ideal. For something like current disk space, a gauge or stat panel gives a quick, clear snapshot.
You can adjust the layout by dragging panel titles to reposition them or resizing panels by dragging their corners. Once you're happy with the setup, click Save dashboard, give it a descriptive name, such as "Production Server Metrics", and save it to an appropriate folder to keep things tidy. Afterward, you can fine-tune your visualizations through panel customization.
Customizing Panels
Customizing your panels improves both the clarity and usability of your dashboards. Under Panel options, you can add meaningful titles and descriptions. Grafana’s newer versions include AI-assisted features that automatically generate these titles and descriptions, saving you time and ensuring consistency.
The Transform tab is a powerful tool for manipulating data when your raw query results need adjustments. You can combine multiple queries, filter out unnecessary values, or perform calculations before displaying the data. Thresholds are especially helpful for open source server monitoring tools; they allow you to set visual cues like color changes when metrics reach specific levels. For instance, you could configure a threshold that triggers a red alert when CPU usage exceeds 80%, making potential issues immediately noticeable.
To monitor IT infrastructure effectively, consider using frameworks like the USE Method (Utilization, Saturation, Errors) for hardware metrics like CPU and memory, or the RED Method (Rate, Errors, Duration) for tracking services and user experience. Standardizing axes across similar panels - such as displaying CPU usage as a percentage instead of raw numbers - makes dashboards easier to interpret quickly.
For better organization, group related panels into rows to create a cleaner layout. You can also use repeating rows or panels with multi-value variables to build dynamic dashboards that update automatically in response to user selections. Before finalizing, preview your changes using the Back to dashboard option, then save your work.
Setting Up Alerts
Once your dashboards are in place, the next step is to configure alerts. Alerts help you monitor your infrastructure automatically by sending notifications based on real-time metrics. Grafana supports two types of alert rules: Grafana-managed alert rules, which can query multiple data sources and handle complex expressions, and data source-managed alert rules, which are stored directly in Prometheus-based sources like Mimir or Loki. For most scenarios, Grafana-managed rules are the better option because they offer more flexibility.
An alert rule has four key components:
- Query: Select the data you want to monitor.
- Condition: Define the threshold for triggering an alert (e.g., "IS ABOVE 80").
- Evaluation Interval: Set how often Grafana checks the condition (e.g., every minute).
- Duration: Specify how long the condition must persist before the alert fires (e.g., five minutes).
For example, to monitor CPU usage, you can query the metrics, set a threshold of "IS ABOVE 80", evaluate every minute, and require the condition to hold for five minutes before triggering an alert.
Multi-dimensional alerting allows you to monitor multiple resources with a single rule. Instead of creating separate alerts for each server or CPU core, a single rule can generate an alert instance for each time series. You can preview the alert rule conditions to see which data series would currently trigger the alert and adjust thresholds accordingly. To avoid "flapping" (alerts firing and resolving repeatedly), set a pending period to ensure the condition persists before firing, and use the "Keep firing for" option to maintain the alert state during brief metric fluctuations.
Creating Alert Rules
Alerts build on the insights from your dashboards, enabling proactive monitoring. To create an alert rule, go to Alerting in the sidebar, select Alert rules, and click + Create alert rule. Here’s how to set one up:
-
Select a Data Source: Choose the source for your query. For example, use
rate(http_requests_total[5m])in Prometheus to track request rates. -
Reduce Expression: Convert your time series data into a single value using options like
Last(most recent value) orMean(average value). - Define Thresholds: Use conditions like IS ABOVE for high CPU/memory usage or IS BELOW for low disk space.
You can also configure Grafana’s behavior when data is missing or there are query errors:
- Alerting: Treat gaps as failures, ideal for critical systems.
- No Data: Distinguish between threshold breaches and data source gaps.
- Keep Last State: Maintain the previous state during temporary issues.
- OK/Normal: Treat gaps as acceptable for non-critical metrics.
Add extra context to your notifications by including a Summary, Description, and Runbook URL in the annotations section. These details help responders address issues faster. Finally, set the evaluation interval (how often Grafana checks the condition) and the pending period (how long the condition must persist before firing), then save your rule.
Configuring Notification Channels
Grafana uses contact points to determine where alerts are sent, such as an email address, Slack channel, or PagerDuty service. Notification policies then route alerts to the appropriate contact point based on specific labels.
To create a contact point:
- Go to Alerting > Contact points and click + Create contact point.
- Give it a descriptive name and choose an integration type (Email, Slack, PagerDuty, etc.).
-
Fill in the required details. For Slack, you’ll need an incoming webhook URL or a bot token (starting with
xoxb) to allow Grafana to upload alert graph images directly to your channel. For email, ensure SMTP settings are configured in thegrafana.inifile.
Always test the connection before saving to ensure everything works as expected.
Next, set up notification policies to route alerts effectively. Navigate to Alerting > Notification policies. You can update the default policy and add child policies with label matchers (e.g., severity=critical) to route alerts to the correct contact point. Customize timing settings like "Group wait" and "Repeat interval", and use mute timings to suppress notifications during maintenance windows or outside working hours without stopping alert evaluations.
For more personalized guidance on optimizing your alert setup, book a demo with the MetricFire team: https://www.metricfire.com/demo/.
Best Practices for Using Grafana
As your Grafana setup grows, keeping it organized, efficient, and secure becomes increasingly important. Without proper structure, you risk "dashboard sprawl", where countless poorly named dashboards clutter your workspace and bog down the system. Think of your Grafana deployment as production infrastructure; it needs to be both structured and secured.
Here are some key practices to ensure your Grafana environment stays efficient and secure.
Dashboard Organization and Naming
Following dashboard best practices ensures your setup remains easy to manage and use. Start by adopting consistent naming conventions that make ownership and purpose clear. For example, include team tags or owner initials in dashboard names to indicate responsibility. Mark test dashboards with prefixes like TEST: or TMP: and delete them when testing is done. Instead of creating separate dashboards for every server or environment, use template variables to create flexible dashboards that can display data for multiple nodes, clusters, or data centers. This approach reduces clutter and simplifies maintenance.
Design dashboards to focus on specific questions or critical metrics. Place the most important metrics in the top-left corner, as this aligns with how users naturally scan screens in a "Z" pattern. Use expandable sections to organize related panels by service or function, and include Text panels to provide context, such as the dashboard’s purpose, links to runbooks, or user instructions.
For easier navigation, consider a "dashboard of dashboards" using the Dashboard List panel. This eliminates the need to manually browse through folders. Add drill-down links to allow users to move seamlessly from high-level summaries to detailed metrics.
Improving Performance
Optimizing the performance of your dashboards ensures they remain responsive and user-friendly. Start by refining your queries. Use specific selectors and filters to limit the data series retrieved. Avoid high-cardinality labels, such as unique user IDs or raw request paths, as they can significantly slow down performance. Leverage Prometheus recording rules to pre-compute complex queries, so dashboards retrieve pre-calculated data instead of recalculating it each time.
Set dashboard refresh rates to match your data update frequency. For example, if your metrics update only every five minutes, avoid refreshing the dashboard every 30 seconds; it wastes resources and slows down browsers. Use the $__interval macro in queries to dynamically adjust time groupings based on the selected time range. Enable incremental querying for Prometheus data sources to fetch only new data since the last refresh.
For environments with multiple users, replace the default SQLite database with MariaDB or MySQL to better handle configurations, users, and dashboard metadata. Limit each graph to 4,000 data points to prevent browser lag. Additionally, use the label_values() function for variables, which queries the data source index rather than the full dataset, improving load times.
Security Setup
Securing your Grafana deployment is just as important as optimizing performance. Start by changing the default admin/admin credentials immediately after installation. Use user roles and permissions to control who can modify production dashboards. Keep in mind that even users with a "Viewer" role can execute arbitrary queries using tools like curl, potentially exposing sensitive data.
Avoid enabling anonymous access unless absolutely necessary. Anonymous access allows anyone to view dashboards, list all folders and data sources, and execute queries without logging in. Always enable HTTPS to encrypt data in transit, especially when accessing Grafana over public networks. For environments requiring heightened security, isolate Grafana from sensitive internal services using network segmentation and firewalls.
To maintain control over changes, store dashboard JSON files in version control. This lets you track, review, and revert changes as needed, following an "infrastructure as code" approach. Regularly audit user permissions to ensure only authorized individuals have access to sensitive data and features.
Conclusion
Grafana simplifies IT infrastructure monitoring by consolidating metrics, logs, and traces from multiple sources into a single platform. This guide covered the essentials: installing Grafana on Windows, Linux, or macOS; connecting data sources like Prometheus; creating dashboards; and setting up alerts to address potential issues proactively. With over 25 million users globally relying on Grafana for observability needs, you're in good company - whether you're part of a startup or a large enterprise.
The initial setup is lightweight and requires minimal system resources, making it suitable for both small-scale labs and full-scale production environments. Once installed, the process is straightforward: link your data sources, design visualizations, and configure alerts to keep your team informed. These steps establish a solid foundation for a reliable, scalable Grafana setup.
Grafana also offers advanced tools to refine your monitoring strategy. The LGTM Stack - Loki for logs, Tempo for traces, and Mimir for metrics - enhances observability. Additionally, the AI-driven Grafana Assistant simplifies query creation and dashboard troubleshooting, even for those without deep PromQL knowledge. Companies like Mux have reported substantial savings by leveraging Adaptive Telemetry to manage their metrics and logs more effectively:
"It not only saves us hundreds of thousands of dollars a year, but it's also a forcing function for us to look closely at our metrics to find additional opportunities for time series reduction and cardinality improvements."
– Ron Lipke, Senior Engineering Manager, Mux
Grafana offers flexibility with its free open-source version, Enterprise edition, and fully managed Grafana Cloud, so you can choose the option that best fits your needs. Start small - experiment with data sources, try different panel types, and gradually develop dashboards that address your team's specific questions. Keeping your setup organized, secure, and optimized ensures your dashboards remain effective as your needs evolve.
For additional support with your monitoring, check out MetricFire’s demo.
FAQs
Should I use SQLite, MySQL, or PostgreSQL for Grafana?
PostgreSQL is often the go-to database for Grafana because it offers excellent availability and scalability. If you're currently relying on SQLite, switching to PostgreSQL can lead to better performance and increased reliability - particularly for larger deployments or critical monitoring environments where stability is key.
How do I connect Grafana to a data source running in Docker?
To link Grafana to a data source in Docker, follow these steps:
-
Confirm that your data source (like Prometheus) is running in Docker and accessible (e.g., via
http://localhost:9090). - In Grafana, navigate to Configuration and select Data Sources.
-
Click Add data source, choose the appropriate type, and input the data source's URL (e.g.,
http://prometheus:9090). - Save your settings to start creating dashboards and visualizations.
How can I reduce alert noise and prevent flapping?
To keep alert noise under control and avoid constant alert flapping, it's important to set recovery thresholds for your alerts and fine-tune the alerting rules. By doing so, you ensure that the alerts you receive are both relevant and actionable. Following Grafana's recommended practices helps reduce unnecessary notifications and keeps your monitoring system running smoothly.
Sign up for the free trial and begin monitoring your infrastructure today. You can also book a demo to speak with the MetricFire team directly about your monitoring needs.

