
Table of Contents
- Introduction
- Key Takeaways
- What is Rancher?
- Overview of Kubernetes Cluster for Monitoring
- Prometheus and Rancher Setup with Docker
- Installing Rancher Server
- Installing the required CLI tools:
- Adding the helm chart repository:
- Creating a namespace for Rancher:
- Choosing your SSL configuration:
- Install cert-manager:
- You can verify your installation as follows:
- Installing Rancher with Helm:
- Verifying that the Rancher Server is successfully deployed
- Saving your options
- Prometheus Setup
- Viewing Metrics from Prometheus in Grafana
- Summary

In this article, we present an overview of cluster monitoring using Rancher and Prometheus and provide some brief setup tutorials for both tools. We further introduce a metric visualization tool called Grafana that transforms your Prometheus time-series data into graphs and visualizations.
MetricFire specializes in monitoring systems. You can use this product with minimal configuration to gain in-depth insight into your environment. If you want to learn more about it please book a demo with MetricFire or sign up for the free trial today.
Introduction
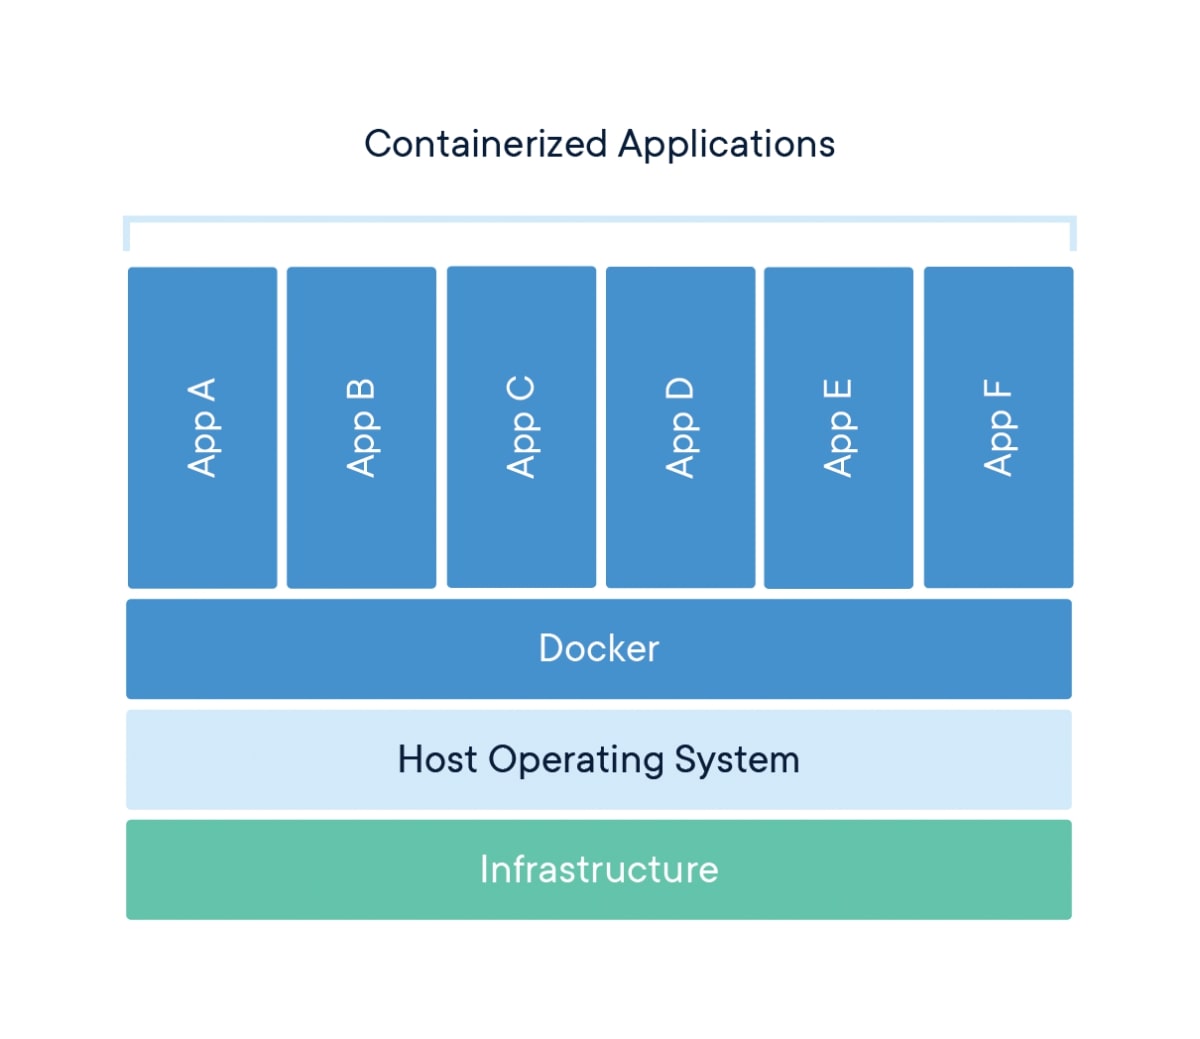
First off, let us recall what a container is. A container is a standardized unit of software that includes everything required to run an application and is available on both Linux and Windows-based applications. Containerized software will always run the same as it includes code, runtime, and systems libraries which isolate the software itself from its environment. Below is an image that was taken from the official Docker website that schematically explains the process of application containerization.
The logical next question would be what does Kubernetes have to do with containers? Typically, your production environment will consist of multiple containers. You need to orchestrate these and make sure that there is no downtime. That is when Kubernetes comes into play.
Kubernetes is responsible for scaling and managing failovers for your application and provides you with storage management, automated rollouts and rollbacks, self-healing, and much more. After deploying Kubernetes you will get a cluster. A Kubernetes cluster is formed by some workers which are also called nodes. There is at least one node in every cluster. Each cluster consists of two main types of components. The nodes host the Pods (a set of running containers in a cluster). The control plane controls the nodes and the Pods in the cluster.
As outlined above, a Kubernetes cluster has multiple components and layers, and there are many potential failure points across all of them that have to be monitored.
Key Takeaways
- Containers are standardized units of software that include everything needed to run an application, and Kubernetes is used to manage and orchestrate containers in a production environment.
- Rancher is an open-source platform that manages multiple Kubernetes clusters, offering centralized control and integration with tools like Prometheus and Grafana for monitoring and visualization.
- Kubernetes cluster monitoring is essential to ensure the overall health and workload of the system, with key metrics including node resource utilization, node availability, and the number of running pods.
- Prometheus is a widely used open-source time-series database for Kubernetes cluster monitoring, while Grafana provides visualization and analytics capabilities for the collected data.
- After setting up Prometheus, Grafana can be configured to visualize the monitoring metrics, with various dashboards available for cluster monitoring.
What is Rancher?
Rancher is an open-source software platform that addresses the challenges of managing multiple Kubernetes clusters. It provides a centralized control plane that orchestrates Kubernetes cluster usage. It also supports any certified Kubernetes distribution. Rancher adds a proper UI layer to Kubernetes and can integrate CI/CD as well as important open-source auxiliary projects such as Prometheus and Grafana. Prometheus is a leading open-source monitoring solution and Grafana is an open-source visualization and analytics software. We will introduce these tools later in this article.
You can also check out our full introduction articles here:
Another benefit of Rancher is its enterprise support. It gives you the confidence you require to deploy Kubernetes in production safely.
Overview of Kubernetes Cluster for Monitoring
Cluster monitoring is a classical use case for Kubernetes monitoring. While monitoring your cluster, you get a broad overview of the overall health and workload of your system. Some important measurable metrics to consider include node resource utilization, the number of nodes available, and the number of pods running.
There are a variety of tools that can be used for Kubernetes monitoring. In this article, we only focus on Prometheus as a tool for cluster monitoring. Prometheus is an open-source time-series database and is considered a default approach to Kubernetes cluster monitoring. A few other monitoring tools include cAdvisor, Heapster, metrics-server, and kube-state-metrics. Additionally, for those of you looking to spare some time and resources when setting up Prometheus, we would recommend considering MetricFire.
MetricFire is a software platform that offers infrastructure, system, and application monitoring using a collection of open-source monitoring tools. We provide a Hosted Graphite monitoring solution. Add Hosted Graphite to your stack to have complete visibility of your metrics.
For those interested in the on-premise version of Prometheus, the next section will focus on the basic setup of Rancher and Prometheus.
Prometheus and Rancher Setup with Docker
Docker has to be installed on any node that you plan to run the Rancher Server on. For example, the following command could be used to install Docker 19.03 on Ubuntu:
curl https://releases.rancher.com/install-docker/19.03.sh | sh
Additionally, Docker Desktop is available for both Mac and Windows.
For more installation options please refer to the official Docker documentation.
Installing Rancher Server
The official Rancher documentation recommends using Helm to install Rancher on a Kubernetes cluster. This installation process is called the high-availability Kubernetes installation. In a standard installation, Kubernetes is first installed on three nodes hosted in Amazon EC2 or Google Cloud Engine. After that, Helm is used to install Rancher on top of the Kubernetes cluster. We will not provide detailed instructions on infrastructure and Kubernetes cluster setup but will rather focus on the Rancher installation. It consists of the following steps:
Installing the required CLI tools:
Adding the helm chart repository:
helm repo add rancher-stable https://releases.rancher.com/server-charts/stable
Creating a namespace for Rancher:
kubectl create namespace cattle-system
Choosing your SSL configuration:
As this is probably the trickiest step, we will focus on it in detail.
The Rancher management server is designed to be secure by default and requires SSL/TLS configuration. There are three recommended settings for the source of the certificate: Rancher-generated TLS certificate, Let’s Encrypt, and Certificate from Files. A rancher-generated TLS certificate is the default option and we recommend using it as a part of this tutorial. In this case, you will need to install cert-manager (we will explain this step next) directly into your cluster.
Install cert-manager:
# Install the CustomResourceDefinition resources separately
kubectl apply --validate=false -f https://github.com/jetstack/cert-manager/releases/download/v0.15.0/cert-manager.crds.yaml

# **Important:**
# If you are running Kubernetes v1.15 or below, you
# will need to add the `--validate=false` flag to your
# kubectl apply command, or else you will receive a
# validation error relating to the
# x-kubernetes-preserve-unknown-fields field in
# cert-manager’s CustomResourceDefinition resources.
# This is a benign error and occurs due to the way kubectl
# performs resource validation.

# Create the namespace for cert-manager
kubectl create namespace cert-manager

# Add the Jetstack Helm repository
helm repo add jetstack https://charts.jetstack.io

# Update your local Helm chart repository cache
helm repo update

# Install the cert-manager Helm chart
helm install \
  cert-manager jetstack/cert-manager \
  --namespace cert-manager \
  --version v0.15.0
You can verify your installation as follows:
kubectl get pods --namespace cert-manager

NAME                                       READY   STATUS    RESTARTS   AGE
cert-manager-5c6866597-zw7kh               1/1     Running   0          2m
cert-manager-cainjector-577f6d9fd7-tr77l   1/1     Running   0          2m
cert-manager-webhook-787858fcdb-nlzsq      1/1     Running   0          2m
Installing Rancher with Helm:
- Set the hostname to the DNS name you pointed at your load balancer.
- If you are installing an alpha version, Helm requires adding the --devel option to the command.
- To install a specific Rancher version, use the --version flag, for example: --version 2.3.6
helm install rancher rancher-stable/rancher \
  --namespace cattle-system \
  --set hostname=rancher.my.org
You should see the following once Rancher has been successfully rolled out:
kubectl -n cattle-system rollout status deploy/rancher
Waiting for deployment "rancher" rollout to finish: 0 of 3 updated replicas are available...
deployment "rancher" successfully rolled out
Verifying that the Rancher Server is successfully deployed
If you see the following error: error: deployment "rancher" exceeded its progress deadline, you can check the status of the deployment by running the following command:
kubectl -n cattle-system get deploy rancher
NAME      DESIRED   CURRENT   UP-TO-DATE   AVAILABLE   AGE
rancher   3         3         3            3           3m
You should expect to see the same count for DESIRED and AVAILABLE.
Saving your options
It is important to save the -set options used during installation. After upgrading Rancher to new versions, you will need to use the same options.
Prometheus Setup
As a cluster owner or administrator, you can configure Rancher to deploy Prometheus for monitoring the Kubernetes clusters.
- From the Global view, navigate to the cluster where you want to configure cluster monitoring.
- Select Tools > Monitoring in the navigation bar.
- Select Enable to show the Prometheus configuration options. Review the resource recommendations to ensure you have enough resources for Prometheus and on your worker nodes to enable monitoring. Enter your desired configuration options.
- Click Save.
Viewing Metrics from Prometheus in Grafana
Now that we have Prometheus set up it is time to analyze some monitoring metrics. The last piece that is missing before we proceed is an actual visualization interface. This is where Grafana comes to the rescue. The Prometheus and Grafana duo has recently become a common technology stack used by DevOps teams. Prometheus functions as the time-series data storage backend and Grafana as the analytical UI.
To define Prometheus as the data source for your metrics you need to configure Grafana as follows:
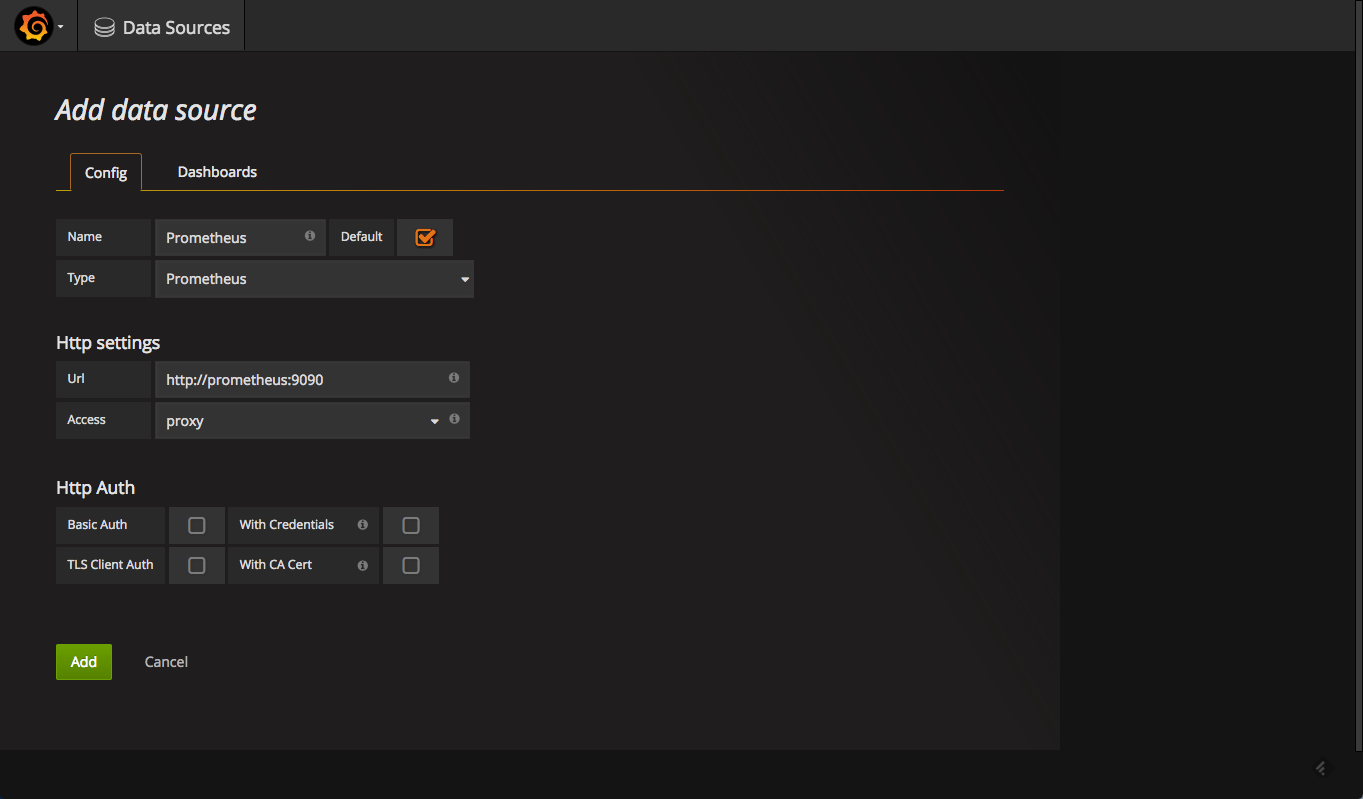
Once this has been done, you can test and save the new data source.
It might be useful to first get familiar with one of the built-in Grafana dashboards that were developed together with the Prometheus team. It’s called ‘Prometheus Stats’ and contains visualizations for various metrics such as uptime, local storage memory series, internal storage queue length, sample ingested, and target scrapes.
There are many free dashboards designed specifically for cluster monitoring. A couple of examples can be imported from here or here. They incorporate summary metrics about containers running on Kubernetes worker nodes.
Summary
In this article, we covered one approach to Kubernetes cluster monitoring that involves using Rancher, Prometheus, and Grafana setups. Rancher is used for managing Kubernetes clusters.
Prometheus can be described as software that scrapes the cluster monitoring metrics and stores them in a time-series database. In its turn, Grafana seamlessly enables querying, analyzing, and visualizing your metrics stored in Prometheus.
Keep in mind that we presented just one possible tech stack, so there are many more that can be applied to Kubernetes cluster monitoring, such as Graphite and Kubernetes. Like and share this article and comment on what stack would you prefer for the described use case.
At MetricFire we provide a Hosted version of Graphite which includes storing your data for two years, a complete Grafana tool for data visualization, and much more. You can use our product with minimal configuration to gain in-depth insight into your environment. If you would like to learn more about it, please book a demo with us, or sign on to the free trial today.


