
Table of Contents
- How To Measure MTTR, MTTA, and MTTD
Great systems are not just built. They are monitored.
MetricFire hosts Graphite & Grafana as a managed service for small engineering teams, taking care of storage, scaling and version updates. Pricing starts at $19/month, billed per namespace metric instead of per host, with engineer-staffed support. Heroku, AWS, Azure, and GCP are natively integrated. We store your data with 3× redundancy in SOC2- and ISO:27001-certified data centres.
How To Measure MTTR, MTTA, and MTTD
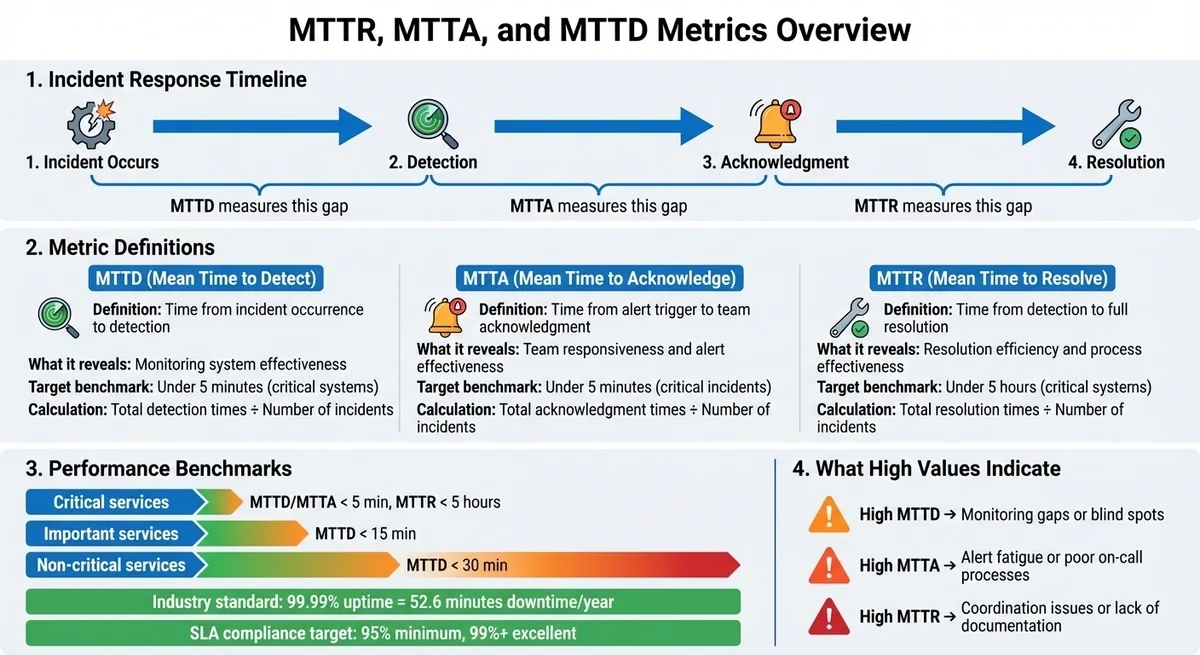
When systems fail, every second counts. Tracking MTTR (Mean Time to Resolve), MTTA (Mean Time to Acknowledge), and MTTD (Mean Time to Detect) helps teams pinpoint where delays occur in incident response. Here's a quick breakdown:
- MTTD: Measures how long it takes to detect an issue. A low MTTD means efficient monitoring.
- MTTA: Tracks the time between an alert and acknowledgement. High MTTA may indicate alert fatigue or poor on-call processes.
- MTTR: Evaluates the time to fully resolve an issue, from detection to long-term fixes.
These metrics reveal gaps in monitoring, response, and resolution processes. For example, high MTTD suggests monitoring issues, while high MTTR might indicate inefficiencies in diagnosing or fixing problems. Leading teams aim for MTTD and MTTA under 5 minutes and MTTR under 5 hours for critical systems.
To calculate:
- MTTD = Total detection times ÷ Number of incidents
- MTTA = Total acknowledgement times ÷ Number of incidents
- MTTR = Total resolution times ÷ Number of incidents
Tracking these metrics ensures faster recovery, better SLA compliance, and improved reliability. Keep reading for detailed formulas, examples, and actionable tips to improve your response process.
MTTR, MTTA, and MTTD Metrics: Incident Response Timeline and Calculation Guide
What Are MTTR, MTTA, and MTTD?
Definitions of Each Metric
These metrics represent critical stages in the incident response process. Let's break them down:
- MTTD (Mean Time to Detect): This tracks the time from when an incident occurs to when it’s detected. It highlights how effective your monitoring systems are at spotting issues.
- MTTA (Mean Time to Acknowledge): This measures the average time between an alert being triggered and a team member acknowledging it. It’s a good indicator of how quickly your team responds to notifications and whether on-call schedules are working.
-
MTTR (Mean Time to Resolve): This measures how long it takes to fully restore service after detecting an incident. MTTR can mean different things depending on your focus, such as:
- Repair: Fixing the specific issue.
- Recovery: Getting the system back online.
- Respond: Time from alert to starting work.
- Resolve: Achieving a long-term fix.
It’s important to clarify which MTTR definition your team uses to ensure accurate tracking and improvements.
Together, these metrics create a complete picture of the incident lifecycle: Occurrence → Detection (MTTD) → Acknowledgement (MTTA) → Resolution (MTTR). Analyzing them side by side can reveal where delays happen. For example, if MTTA is high but MTTR is low, the issue might be related to alert fatigue or unclear responsibilities rather than technical challenges. Clear definitions for these metrics help teams focus on improving each stage of the process.
Why These Metrics Matter
These metrics provide the data you need to make informed decisions about tools, staffing, and process automation. Without them, you’re essentially working blind. For critical systems, the goal is often to keep MTTD and MTTA under 5 minutes. High-performing teams strive to resolve critical (SEV-1) incidents within 1 hour.
The business stakes are high. Leading tech companies aim for 99.99% uptime, which translates to just 52.6 minutes of downtime annually. For example:
- LetsGetChecked: After implementing the Cortex Catalog in 2024, they cut their MTTR by 67% by eliminating the time spent searching for information during incidents.
- Papa John’s: By deploying custom monitoring dashboards, they reduced issue identification time from days to same-day fixes.
Tracking these metrics also supports SLA compliance. Most organizations aim for at least 95% SLA compliance, with 99% or more considered excellent. However, nearly 90% of companies don’t measure incident metrics until a ticket is created, missing the critical time between detection and acknowledgement. This gap can skew MTTR data and hide bottlenecks in the response process. By addressing these blind spots, teams can improve both performance and reliability.
How to Calculate MTTD (Mean Time to Detect)
Calculation Steps for MTTD
To calculate Mean Time to Detect (MTTD), you need to sum up all the times it took to detect incidents and divide that total by the number of incidents. The process hinges on accurate timestamps to ensure precision.
Here’s how you can do it:
- Log every incident automatically, ensuring no gaps in data collection.
- Pinpoint the start time - this is when the issue first occurred.
- Record the detection time - this could be when your monitoring system flagged the issue or when a user reported it.
- Calculate the elapsed time by subtracting the start time from the detection time.
- Add all elapsed times together and divide by the total number of incidents.
Let’s break it down with an example. A manufacturing facility recorded four incidents in one week:
| Incident | Start Time | Detection Time | Elapsed Time (Minutes) |
|---|---|---|---|
| 1 | 4:45 AM | 6:43 AM | 118 |
| 2 | 2:01 AM | 2:54 AM | 53 |
| 3 | 9:05 AM | 11:33 AM | 148 |
| 4 | 3:44 PM | 5:09 PM | 85 |
| Total | 404 |
MTTD = 404 minutes ÷ 4 incidents = 101 minutes.
Using a reliable monitoring platform can streamline this process. Setting up an infrastructure monitoring dashboard allows for real-time visibility into these metrics. Tools like MetricFire provide automated incident tracking and synchronized timestamps, which make MTTD calculations more accurate and less labor-intensive.
One critical tip: don’t start the clock when creating the ticket.
"90% of companies don't start measuring for any MTTx results until a ticket is created. When you skip steps in the process, however, you manipulate the results of MTTR".
What MTTD Reveals About Your Monitoring
MTTD acts as a performance indicator for your monitoring systems. A low MTTD shows that issues are being identified quickly, while a high MTTD may point to inefficiencies or blind spots in your detection setup.
To gauge effectiveness, set benchmarks based on the criticality of services:
- Critical services: MTTD under 5 minutes
- Important services: MTTD under 15 minutes
- Non-critical services: MTTD under 30 minutes.
Consistently missing these benchmarks suggests a need to reassess and enhance your monitoring strategy. A stark example is the 2017 Equifax breach, in which detection took more than 70 days and affected 147 million individuals. Such delays highlight severe gaps in detection capabilities.
If users spot issues before your monitoring systems do, that’s a glaring problem. It indicates an over-reliance on external notifications. To address this, broaden your monitoring scope to include business transactions and error rates alongside infrastructure metrics. This ensures that user-impacting problems are identified promptly.
How to Calculate MTTA (Mean Time to Acknowledge)
Calculation Steps for MTTA
Mean Time to Acknowledge (MTTA) tracks how quickly your team responds after an alert is triggered. To calculate it, you’ll need the timestamps for when each alert was fired and when it was acknowledged. Subtract the alert time from the acknowledgement time for each incident, add up all these durations, and then divide by the total number of incidents.
Here’s an example to clarify. A DevOps team monitored five incidents over a week:
| Incident | Alert Triggered | Acknowledged | Elapsed Time (Minutes) |
|---|---|---|---|
| 1 | 2:15 AM | 2:19 AM | 4 |
| 2 | 10:33 AM | 10:48 AM | 15 |
| 3 | 5:22 PM | 5:25 PM | 3 |
| 4 | 11:47 PM | 12:23 AM | 36 |
| 5 | 8:05 AM | 8:12 AM | 7 |
| Total | 65 |
Using this data, the MTTA is calculated as:
MTTA = 65 minutes ÷ 5 incidents = 13 minutes
Tools such as automated monitoring systems can simplify this process by capturing exact timestamps for alerts and acknowledgements, reducing the risk of errors in manual tracking.
What MTTA Tells You
MTTA provides a snapshot of your team’s responsiveness to alerts. A lower MTTA indicates faster reaction times, whereas a higher MTTA can indicate issues such as alert fatigue, delayed notification delivery, or confusion about on-call responsibilities.
Response time benchmarks depend on the severity of the incident. For critical issues, aim for acknowledgement within 5 minutes. High-priority incidents should be acknowledged within 10 minutes, while medium-priority incidents should be acknowledged within 20 minutes. An MTTA of 36 minutes is generally too slow for modern incident management. Reducing it to under 5 minutes can significantly decrease downtime and improve overall efficiency.
If your MTTA trends upward, it could signal alert fatigue. This often happens when too many false alarms desensitize engineers, leading to slower responses for genuine issues. To address this, fine-tune your alert thresholds to prioritise actionable notifications. Additionally, set up escalation policies that notify backup responders if the primary on-call engineer doesn’t acknowledge an alert within the expected timeframe.
Next up, learn how to calculate MTTR to complete your incident response metrics analysis.
How to Calculate MTTR (Mean Time to Resolve)
Calculation Steps for MTTR
Mean Time to Resolve (MTTR) measures the average time it takes to fully address and prevent the recurrence of an incident. The formula is simple: add up the total resolution time for all incidents in a given period, then divide by the number of incidents.
Let’s break it down with an example: Suppose five incidents occurred over two weeks.
| Incident | Detection Time | Full Resolution Time | Elapsed Time (Minutes) |
|---|---|---|---|
| 1 | 1:30 AM | 2:45 AM | 75 |
| 2 | 9:15 AM | 11:30 AM | 135 |
| 3 | 3:45 PM | 4:20 PM | 35 |
| 4 | 10:20 PM | 2:35 AM | 255 |
| 5 | 7:10 AM | 8:40 AM | 90 |
| Total | 590 |
Using this data, the formula would look like this:
MTTR = 590 minutes ÷ 5 incidents = 118 minutes (about 2 hours)
To get accurate results, it’s crucial to capture timestamps for every stage - detection, resolution, and root cause analysis. Manual tracking can lead to errors, so automated tools are often a better choice. Platforms like MetricFire record precise timestamps throughout the incident lifecycle, reducing the risk of errors.
4 Different Meanings of MTTR
The term MTTR can be confusing because it refers to four distinct metrics, each focusing on a different aspect of incident management.
| MTTR Variant | What It Measures | When to Use It |
|---|---|---|
| Mean Time to Repair | Time spent actively diagnosing and fixing a system | Useful for maintenance or hardware teams tracking physical repairs |
| Mean Time to Recovery | Total downtime from failure to full service restoration | Ideal for DevOps teams monitoring system uptime and SLA adherence |
| Mean Time to Respond | Time from the first alert to initiating recovery efforts | Common in cybersecurity for assessing reaction speed |
| Mean Time to Resolve | Full lifecycle, including root cause analysis and prevention | Best for teams focused on reliability and recurrence prevention |
"It's the difference between putting out a fire and putting out a fire and then fireproofing your house." - Atlassian
Among these, Mean Time to Resolve stands out because it encompasses everything from initial detection to ensuring the issue doesn’t recur. This could involve steps such as updating monitoring tools, revising runbooks, or fixing deeper code issues. To maintain consistency, teams should agree on which MTTR definition they’re using before analyzing or reporting metrics.
Understanding these variations can help you identify whether delays stem from detection, repair, or prevention efforts.
What MTTR Reveals About Resolution
Once you’ve calculated MTTR and clarified its variations, it’s time to interpret what the numbers say about your processes.
MTTR often highlights bottlenecks in your incident response. A high MTTR may indicate limited visibility into systems, inefficient manual workflows, or poor communication between development and operations teams.
For metrics like Mean Time to Repair or Mean Time to Recovery, a common benchmark is under five hours. If your MTTR exceeds this, try segmenting incidents by severity. For instance, critical P1 issues require different handling than lower-priority P3 incidents. Combining all incidents into a single analysis can obscure specific problem areas.
Tracking Mean Time Between Failures (MTBF) alongside MTTR can provide further insights. If MTTR improves but MTBF remains static, it may indicate temporary fixes that don’t address root causes. As Brian Amaro, Sr. Director Global Solutions at ScienceLogic, puts it:
"Workarounds are the bane of IT operations. They hide evidence of poor performance while providing just enough plausible deniability of an actual problem to allow things to continue uncorrected."
When starting with MTTR tracking, many organizations establish a baseline (e.g., 90 minutes) and set improvement goals, such as reducing MTTR by 20% within three months and 40% within six months. Measuring the entire incident lifecycle - from detection to permanent resolution - provides the data needed to boost reliability and efficiency.
Using These Metrics to Improve Incident Response
How to Analyze Multiple Metrics Together
Once you've determined your MTTD, MTTA, and MTTR, the next step is to evaluate how these metrics interact. This combined analysis can uncover process inefficiencies and help refine your approach. Identifying where delays occur - whether in detection, acknowledgement, or resolution - can spotlight areas that need attention.
For instance, a high MTTD paired with low MTTA and MTTR might indicate that your monitoring tools are lagging, leading to situations where users report issues before your system does. On the other hand, if MTTA is high while MTTD and MTTR remain low, it could indicate that alerts are being overlooked or delayed, possibly due to alert fatigue or poorly designed notification systems. Similarly, a high MTTR despite quick detection and acknowledgement often points to challenges in diagnosing or resolving issues, which might stem from missing runbooks or weak team coordination.
"The highest-impact improvements often come from coordination, not technical speed. Eliminating confusion about who should investigate saves more time than faster troubleshooting." - Upstat
It's also essential to avoid focusing solely on one metric at the expense of others. For example, if MTBF (Mean Time Between Failures) drops while MTTR remains high, it could indicate a reliance on temporary fixes rather than addressing underlying problems.
| Metric | High Value Indicates | Improvement Strategy |
|---|---|---|
| MTTD | Monitoring gaps; users report issues first | Multi-region monitoring; smarter alerting rules |
| MTTA | Alert fatigue or poor notification processes | Fine-tune on-call schedules; reduce false alerts |
| MTTR | Coordination issues; lack of documentation | Automate rollbacks; create detailed runbooks |
By examining these metrics together, you can create actionable strategies to minimize delays and optimize your incident response.
Steps to Reduce MTTD, MTTA, and MTTR
To improve detection, acknowledgement, and resolution times, consider these focused strategies:
For MTTD:
Expand monitoring to include not just infrastructure but also business transactions, like API error rates. Multi-region monitoring can help detect location-specific issues, while fine-tuning alert thresholds can reduce unnecessary noise. Industry standards recommend an MTTD of under 5 minutes for critical systems.
For MTTA:
Automate escalation policies so backup engineers are notified if the primary responder doesn't acknowledge an alert quickly. Use multiple communication channels - like SMS, email, and mobile notifications - to ensure alerts reach the right person. Top-performing teams strive for an MTTA of under 5 minutes for high-priority incidents.
For MTTR:
Keep runbooks up to date for recurring issues and automate repetitive tasks such as service rollbacks and restarts. After significant incidents, conduct detailed post-incident reviews to analyze where delays occurred across all three metrics. Tools like MetricFire can automate timestamp tracking during incidents, ensuring no critical data is lost under pressure.
It’s also smart to track metrics by severity level. Handling a P1 incident (critical) differs significantly from lower-priority issues, and averaging all incidents together can obscure key delays.
Incident Metrics Explained: MTTD, MTTR & Volume KPIs
Conclusion
MTTD, MTTA, and MTTR transform incident response from a reactive scramble into a structured, data-focused improvement process. Each metric pinpoints a specific weak spot: MTTD identifies monitoring deficiencies, MTTA uncovers issues in alerting or staffing, and MTTR evaluates how efficiently technical problems are resolved. Without consistent measurement, these underlying issues remain hidden. Accurate tracking of these metrics directly impacts business performance.
These metrics also play a key role in customer satisfaction and meeting contractual SLAs. Leading companies aim for 99.99% uptime - equivalent to just 52.6 minutes of downtime annually. For critical services, they strive to keep MTTD and MTTA under 5 minutes and MTTR under 5 hours, ensuring MTTR remains 20–30% below SLA thresholds. This margin acts as a safety net, protecting against penalties and reputational harm.
"If you don't measure each step consistently every time, you can't determine whether you've actually fixed the problem or if you've merely suppressed the symptom."
– Brian Amaro, Sr. Director Global Solutions, ScienceLogic
Automated tracking tools are becoming indispensable. Platforms like MetricFire record exact incident timestamps, enabling precise baseline measurements.
While metrics highlight problems, it's people who solve them. Monitoring gaps, delayed responses, and prolonged resolutions each have measurable effects on service quality. A blameless culture, where data drives process improvements rather than assigning blame, helps teams focus on preventing future issues instead of just speeding up temporary fixes. By embedding these metrics into every stage of incident management, teams can refine their processes over time. Track metrics by severity, study trends over months, and use post-mortems to identify breakdowns in detection, acknowledgement, and resolution. This approach ensures continuous improvement and a stronger, more resilient response system.
FAQs
How can my team improve MTTR, MTTA, and MTTD?
Improving MTTR (Mean Time to Repair), MTTA (Mean Time to Acknowledge), and MTTD (Mean Time to Detect) requires fine-tuning your incident response strategies and using the right tools to stay ahead.
To minimize MTTD, invest in advanced monitoring systems that can spot issues as soon as they occur. For faster MTTA, set up clear alerting protocols and automate notifications so incidents are acknowledged without delay. Enhancing MTTR involves crafting detailed response plans, automating repetitive tasks, and ensuring your team undergoes regular training to boost their efficiency during repairs and recovery.
Regularly analyzing incident data and pinpointing bottlenecks in your processes can further optimize these metrics, driving steady improvements across the board.
What causes high MTTA, and how can it be reduced?
High MTTA (Mean Time to Acknowledge) often stems from delays in spotting incidents, ineffective alert prioritization, or clunky communication workflows. These problems can arise due to outdated monitoring tools, poorly defined escalation paths, or an overload of alerts that drown out critical issues.
To tackle high MTTA, start by upgrading your monitoring tools to ensure quicker and more precise incident detection. Fine-tune your alerting protocols so that critical issues are flagged and sent to the right team members without delay. Additionally, setting up clear communication channels and routinely reviewing alert thresholds can significantly improve response times, making incident management smoother and more effective.
Why should MTTR, MTTA, and MTTD be tracked separately for different incident severity levels?
Tracking MTTR (Mean Time to Resolve), MTTA (Mean Time to Acknowledge), and MTTD (Mean Time to Detect) separately for various incident severity levels allows teams to focus on what matters most. By sorting incidents based on their severity, you can prioritize the most critical issues, allocate resources where they’re needed most, and address high-impact problems more quickly. This helps reduce downtime and limits disruptions to business operations.
It also offers a clearer view of performance trends. With this data, teams can pinpoint areas that need improvement and fine-tune their response processes for specific types of incidents.
Sign up for the free trial and begin monitoring your infrastructure today. You can also book a demo and talk to the MetricFire team directly about your monitoring needs.

