
Table of Contents
- Introduction
- Why Nginx Logs Matter for Performance Monitoring
- Step 1: Configure Promtail to Collect Nginx Logs
- Step 2: Connect Loki in Hosted Grafana
- Step 3: Visualize and Query Nginx Logs in Grafana Dashboards
- Step 4: Collect and Forward Nginx Metrics with Telegraf
- FAQs
- Troubleshooting Common Nginx Log Issues
- Conclusion: Combine Nginx Logs and Metrics for Full Observability
Great systems are not just built. They are monitored.
MetricFire runs Graphite and Grafana as a fully managed service for growing engineering teams, taking care of storage, scaling, and version updates so your team doesn't have to. Plans start at $19/month, billed per metric namespace rather than per host, and include engineer-staffed support. Integrations work natively with Heroku, AWS, Azure, and GCP, and data is stored with 3× redundancy in SOC2- and ISO:27001-certified data centres.
Introduction
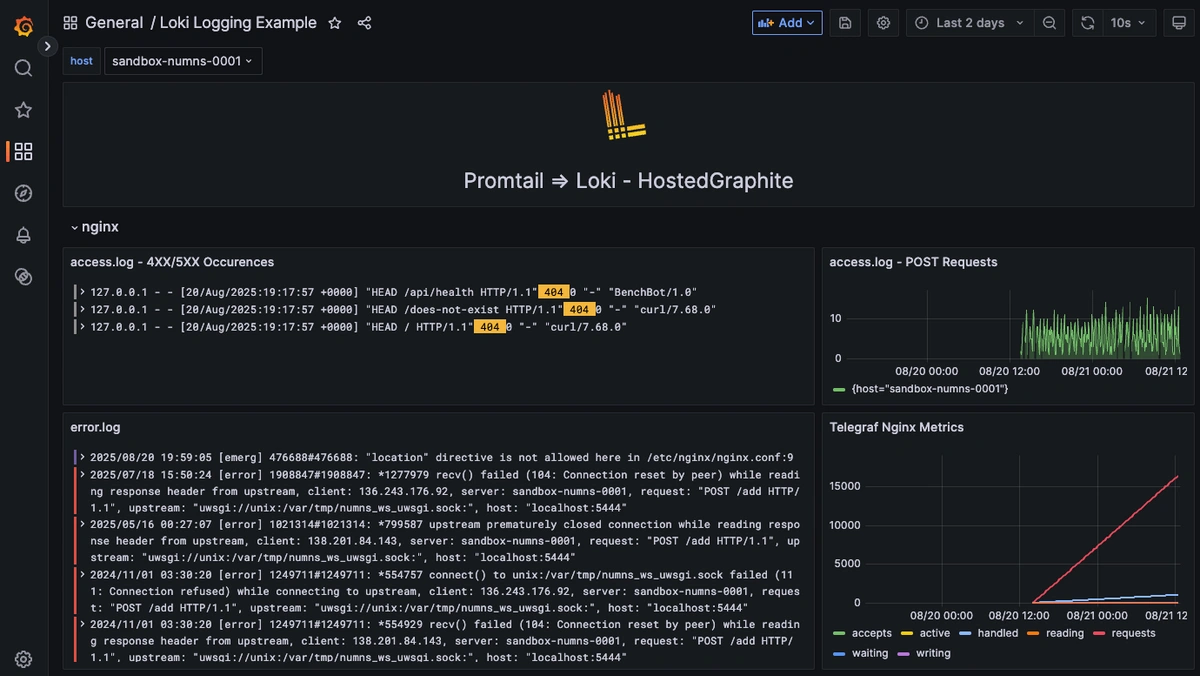
When a web service slows down or errors spike, metrics can tell you what changed (active connections rise, error rate increases), but the root cause can sometimes be found in your logs (which IPs are hammering POST endpoints, 4XX/5XX occurrences). Put the two together and you get the full observability picture. Time-series metric trends to spot incidents, and line-level details to fix them fast.
Monitoring Nginx logs alongside metrics helps pinpoint slowdowns and errors fast. In this guide, you’ll learn how to set up Promtail and Telegraf to send both to Hosted Loki and Grafana for complete visibility.
Start a chat with us today to test MetricFire's Logging Integration for FREE. We will help you every step of the way, from collection to visualization!
Why Nginx Logs Matter for Performance Monitoring
When you see a traffic spike or latency increase in Grafana, metrics tell you what changed, but Nginx logs explain why. Access logs show which clients or endpoints drove the surge, while error logs expose configuration issues, upstream timeouts, or 5XX responses. By pairing Nginx logs with performance metrics from Telegraf, you get both high-level trends and the detailed context needed to resolve problems quickly. This combination turns raw server data into actionable insight for capacity planning, anomaly detection, and uptime optimization.
Step 1: Configure Promtail to Collect Nginx Logs
We support log collection via OpenTelemetry Contrib and Promtail. In this example, we'll detail how to configure Promtail since it is an official log shipping agent for Grafana Loki. It runs as a lightweight binary that tails log files (like /var/log/*) and forwards them to our Hosted Loki endpoint over HTTP (this article assumes that you are already running an instance of Nginx that serves traffic on a designated port).
Install/unpack Promtail (Ubuntu)
wget https://github.com/grafana/loki/releases/download/v3.5.3/promtail_3.5.3_amd64.deb

sudo apt-get install -y ./promtail_3.5.3_amd64.deb
Promtail Configuration Example for Nginx Access and Error Logs
Update your Promtail configuration file at /etc/promtail/config.yml to include the following:
server:
  http_listen_port: 9080
  grpc_listen_port: 0

positions:
  filename: /tmp/positions.yaml

clients:
  - url: https://<YOUR-API-KEY>@www.hostedgraphite.com/logs/sink

scrape_configs:
  - job_name: varlogs
    static_configs:
      - targets:
          - localhost
        labels:
          host: <HOST-NAME>
          job: varlogs
          __path__: /var/log/nginx/*.log
NOTE: Make sure to replace YOUR-API-KEY and HOST-NAME in the above config and restart the Promtail service:
sudo systemctl restart promtail
sudo systemctl status promtail
Step 2: Connect Loki in Hosted Grafana
REACH OUT TO US about trying our new Logging feature for FREE, and we will create a Loki Access Key in your Hosted Graphite account. If you don't already have a Hosted Graphite account, sign up for a free trial here to obtain a Hosted Graphite API key and Loki Access Key.
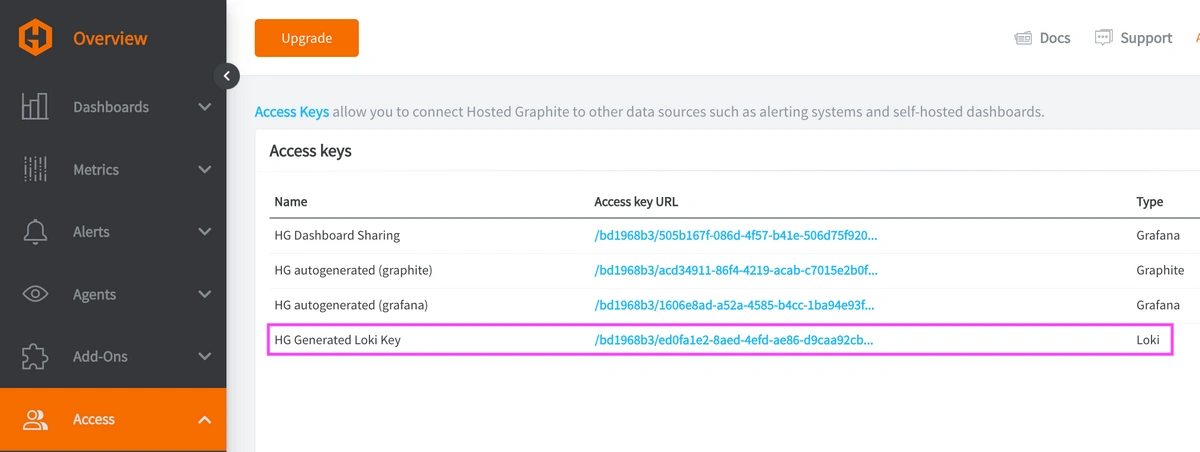
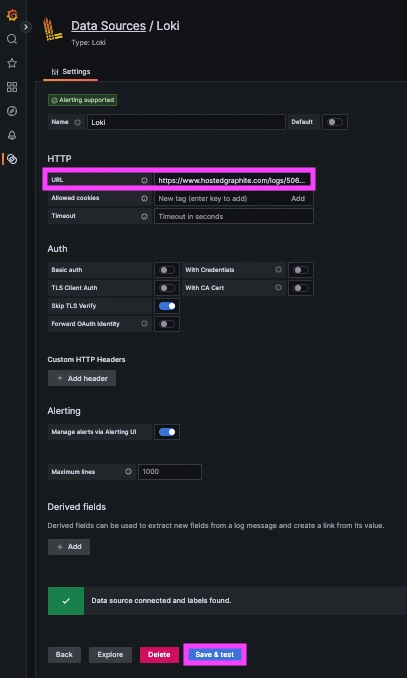
Now, within the Hosted Graphite UI, you can navigate to Dashboards => Settings => Data sources => Add New Data source (Loki). You'll be able to add the URL for your HG Loki endpoint, which includes your new Loki Access Key: https://www.hostedgraphite.com/logs/<UID>/<LOKI-ACCESS-KEY>
Step 3: Visualize and Query Nginx Logs in Grafana Dashboards
Once system logs are forwarded to our Loki endpoint and the data source is connected in your Hosted Grafana, you can create a new dashboard panel, select Loki as your Data source, and format a query using 'code mode'.
- LogQL query that excludes notices: {job="varlogs", filename="/var/log/nginx/error.log"} !~ "\\[notice\\]"
- Query to display only 4XX/5XX lines: {job="varlogs", filename="/var/log/nginx/access.log"} |~ " (4\\d\\d|5\\d\\d) "
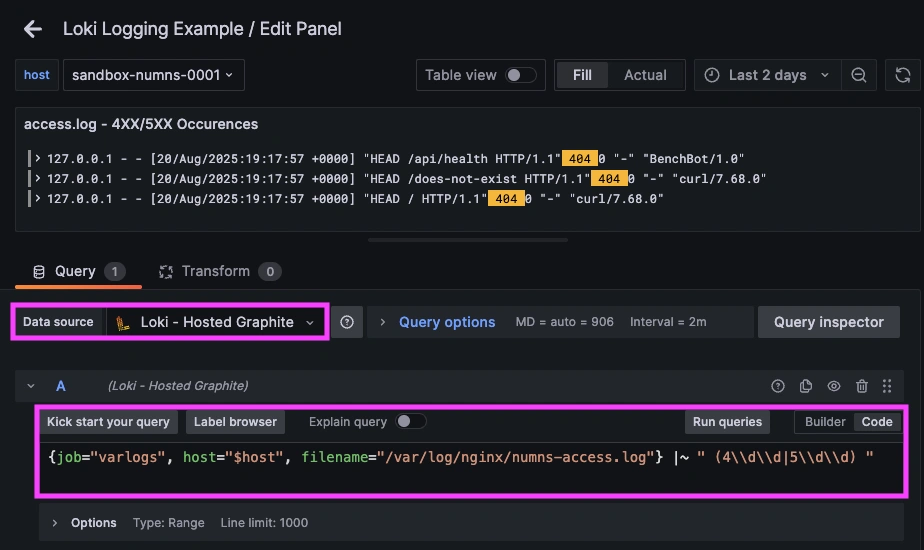
Now you can view each 4XX/5XX request and see exactly when each one occurred.
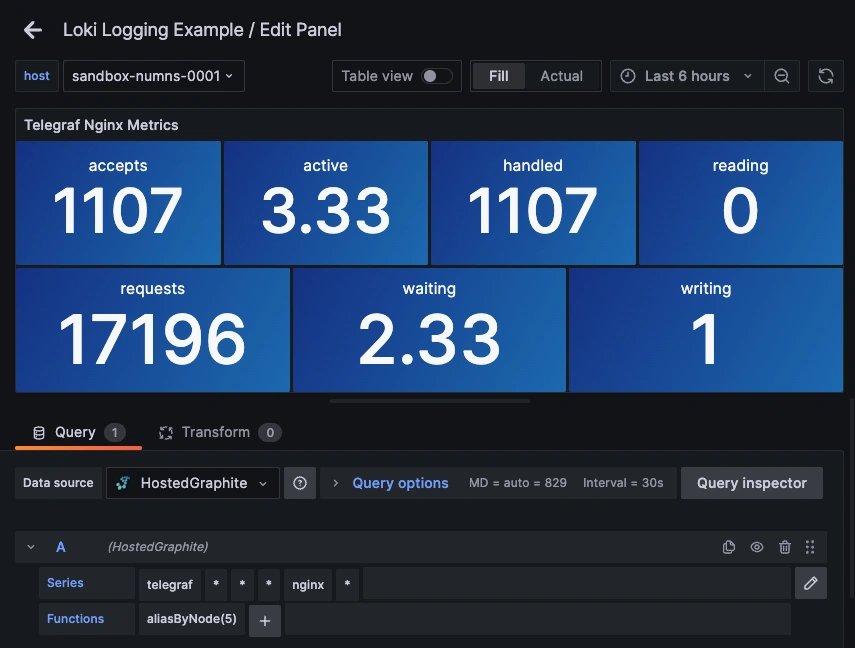
Step 4: Collect and Forward Nginx Metrics with Telegraf
Enable Nginx Stub_Status for Metrics Collection
If you have NGINX running in a Linux environment, you'll need to modify your /etc/nginx/nginx.conf file. Add a status endpoint inside the server{} block of the conf file:
location = /nginx_status {
    stub_status;
    allow 127.0.0.1;
    deny all;
}
NOTE: the default app port for nginx out of the box is :80, but you'll have to define a different port if :80 is already taken. Find out which ports are bound to nginx with this command:
sudo ss -ltnp | grep nginx
Now you can apply and verify the configuration updates with these commands:
sudo nginx -t && sudo systemctl reload nginx

curl -s http://127.0.0.1:<YOUR_APP_PORT>/nginx_status
Set up the Telegraf Collector
If you don't already have an instance of Telegraf running on your server, install our handy HG-CLI tool to quickly install/configure Telegraf:
curl -s "https://www.hostedgraphite.com/scripts/hg-cli/installer/" | sudo sh
NOTE: You will need to input your Hosted Graphite API key and follow the prompts to select which metric sets you want.
Once it's installed, open the Telegraf configuration file at: /etc/telegraf/telegraf.conf and add the following section:
[[inputs.nginx]]
  urls = ["http://127.0.0.1:<YOUR_APP_PORT>/nginx_status"]
Configure Telegraf to Send Nginx Metrics
Simply save your updated conf file, and restart the Telegraf service to forward the Nginx metrics to your HG account. Or run it manually to inspect the output for potential syntax/permission errors:
telegraf --config /etc/telegraf/telegraf.conf
Once these metrics hit your Hosted Graphite account, you can use them to easily create custom dashboards and alerts!
Example metric query: telegraf.*.*.127_0_0_1.nginx.*
FAQs
Q1. What are Nginx logs used for?
Nginx logs record client requests and server responses. They’re used to identify slow endpoints, frequent errors, and unusual traffic patterns.
Q2. How can I monitor Nginx performance using Loki and Telegraf?
Send logs to Loki with Promtail and collect metrics with Telegraf’s Nginx plugin. Both can be visualized together in Grafana for full observability.
Q3. What is Promtail in Grafana Loki?
Promtail is a lightweight log shipping agent for Grafana Loki that tails files like /var/log/nginx/*.log and forwards them to Loki via HTTP.
Q4. Why is Nginx stub_status important?
The stub_status module exposes live performance metrics such as active connections, requests per second, and handled requests—critical for real-time monitoring.
Q5. How do I troubleshoot missing Nginx logs in Grafana?
Check Promtail permissions, verify the file paths, and confirm your Loki data source is configured correctly in Hosted Grafana.
Troubleshooting Common Nginx Log Issues
Even a solid configuration can hit snags when forwarding logs to Loki or visualizing them in Grafana. Here are a few common Nginx log problems and quick fixes:
-
Permission errors:
Promtail may lack read access to/var/log/nginx/*.log. Grant the Promtail user permission or adjust group ownership withsudo chownorchmodas needed. -
Missing access logs:
Confirm your Nginx configuration includes bothaccess_loganderror_logdirectives, and that they point to the correct file paths defined in the Promtail config. -
Grafana query not returning results:
Double-check your Loki data source settings and LogQL filters. Queries with overly strict regex (like excluding notices or info) can hide valid log entries. -
Log ingestion delays:
If logs appear late, verify system clock synchronization (NTP) and Promtail’spositions.yamlfile to ensure offsets are tracked correctly. -
High log volume or dropped lines:
Consider batching or rate-limiting settings in Promtail, or split large log files into separate scrape jobs for better throughput.
Conclusion: Combine Nginx Logs and Metrics for Full Observability
Nginx is a crucial part of any stack, so pairing time-series metrics with corresponding log lines is the fastest path from symptom to root cause. With a quick Nginx update for stub_status, a minimal Telegraf input, and Promtail forwarding logs, your dashboards can display when something went wrong and link directly to the cause. Instead of jumping between tools or manually inspecting your server logs, you can correlate a spike in metrics with the exact log line that makes sense, all in a single dashboard.
MetricFire's Hosted Loki logging integration is quick to set up but powerful in practice. Whether you're tracking security threats, service issues, failed jobs, or kernel anomalies, it gives you the visibility you need to stay ahead of problems and reduce the time it takes to resolve them. Check out how we advise solving a 502 Bad Gateway error when using NGINX with PHP-FPM too!
Reach out to the MetricFire team today and let’s build something great together!

