
Table of Contents
Continuous Integration (CI) and Continuous Delivery (CD) form the backbone of the product delivery lifecycle. A well tuned, fault tolerant and scalable CI/CD pipeline is very important to support modern Agile teams.
Despite obvious business advantages, a rapid release approach combined with continuous change processes resulting from DevOps principles will in the long run generate new challenges. The entire process needs to be carefully examined and controlled. Neglecting this aspect can cost you dearly.
A way to mitigate this risk is to implement a Continuous Monitoring and Observability solution—the final capability for a CI/CD pipeline. By invoking the DevOps “measure everything” principle, a Continuous Monitoring tool will allow you to take advantage of the following features:
- Analyzing long-term trends: How many builds am I running daily? How many did I run a month ago? Do I need to scale my infrastructure up or down?
- Over-time comparison: Is my deployment slower than it was last week? Or is it faster?
- Vulnerability scans: Does my code introduce any critical software faults and security vulnerabilities such as memory leaks, uninitialized variables, array-boundary? How rapidly are they detected? How quickly are they fixed?
- Alerting: Is something broken, or might break soon? Did my test pipeline pass? Should I perform a rollback on my latest deployment?
- Conducting ad-hoc retrospective analysis: My latency just shot up, what else happened around the same time? Are those events related to each other?
MetricFire can help you ensure that this backbone is monitoring properly and you have complete insight into the software delivery pipeline. MetricFire specializes in monitoring systems and you can use our product with minimal configuration to gain in-depth insight into your environments. If you would like to learn more about it please book a demo with us, or sign up for the free trial today.
Today we will learn how to monitor Kubernetes based CI/CD pipelines using Prometheus.
CI/CD Overview
Continuous Integration
Continuous Integration (CI) is a development practice that requires developers to integrate code into a shared repository several times a day. Each check-in is then verified by an automated build, allowing teams to detect problems early. By integrating regularly, you can detect errors quickly, and locate them more easily.
With CI, a developer practices integrating the code changes continuously with the rest of the team. The integration happens after a “git push,” usually to a master branch—more on this later. Then, in a dedicated server, an automated process builds the application and runs a set of tests to confirm that the newest code integrates with what’s currently in the master branch.
If you’re doing CI and for some reason the integration fails, that means the broken build becomes the highest priority to fix before continuing to add more features. System quality—not just velocity—is important. CI works in three simple stages: push, test, and fix. But despite this simplicity, CI might become challenging if only a few members of the team practice it. Consequently, CI also requires a change in culture and support from management.
Tools for CI
CI is mainly a cultural shift, but some tools could help you to get the job done quickly. Here’s a list of common tools that you can start using today.
- Jenkins—a free, open-source, Java-based tool that gives you a lot of flexibility.
- Azure Pipelines—a Microsoft product free for up to five users and open-source projects.
- Cloud Build—the managed service offering from Google Cloud Platform.
- Travis CI—a popular tool for GitHub open-source projects that offers a hosted or self-hosted solution.
- GitLab CI—a free tool from GitLab that can also integrate with other tools via the API.
- CircleCI—a tool that’s popular for GitHub projects and has a hosted and self-hosted solution. You can start for free.
- CodeShip—a self-hosted-only solution. You can start with the free version, but it’s a paid tool.
There are more CI tools, but I wanted to keep the list short with the tools I’ve personally used.
Continuous Delivery
Continuous Delivery is the ability to get changes of all types—including new features, configuration changes, bug fixes and experiments—into production, or into the hands of users, safely and quickly in a sustainable way. We achieve all this by ensuring our code is always in a deployable state, even in the face of teams of thousands of developers making changes on a daily basis.
Ha! CD sounds fantastic, right? Indeed. You’re delivering changes of all types into a live environment all the time; you can ship configuration changes, infrastructure changes—everything! Usually, CI is known to be a developer’s practice and CD an operator’s practice. CI’s mission is to provide an artifact at some point in time of the application that satisfies customer expectations—in other words, that has good quality built in.
CD’s mission is then to move those artifacts throughout all the different environments of an organization’s development lifecycle. What’s critical in CD is that it will always deploy the same artifact in all environments. Therefore, a build in CI happens only once and not for each environment. The artifact produced will work with placeholders or environment variables for the build-once approach to work.
Another critical factor is that for a deployment to be smoother, each environment other than production needs to be similar to production. Development, testing, and staging should be a production-like environment. Homogeneous environments might be hard to achieve in big organizations, but the idea is to use the same tooling, process, and configurations in all the environments. In CD, production is not a special environment; it’s just another stage in the pipeline.
At some point, deployments to any environment will be boring. And that’s a good thing!
Tools for CD
A few of the tools for CD are also tools for CI. That’s why I’ll repeat a few tools here from the CI tools list. But there’s also a few new ones.
- Jenkins—can also be used for CD with its pipeline as code, Ansible, or Terraform plugins.
- Azure Pipelines—has a release definition section that you can integrate with a build stage from CI.
- Spinnaker—gaining popularity, and it’s the tool that Netflix uses to do releases in a CD way.
- GitLab CI—lets you configure deployment and release pipelines with GitLab.
- ArgoCD—the Intuit offering that applies the GitOps principles.
Again, this list fails to capture how many tools are actually out there. But the purpose is only to give you a few options. You can use whatever tool works best for you.
Since, both CI/CD is critical to any organization it is extremely important to ensure that proper monitoring for them is in place.
Monitoring a Kubernetes CI/CD Pipeline
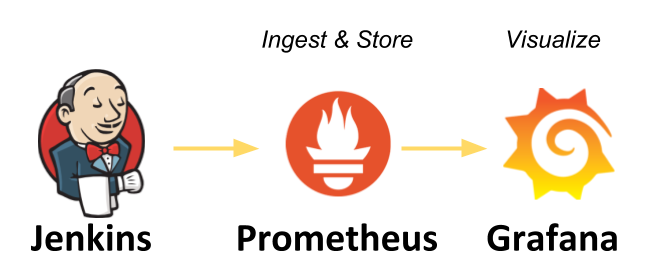
The easiest way to monitor any Kubernetes workload is using Prometheus. It also holds true for a CI/CD pipeline. For example, let’s take the example of a pipeline which looks something like this:
- Github: Has code repository and Kubernetes app Helm chart repo
- Jenkins: Gets triggered by Gitub and does the following:
- Builds the code repo
- Runs UTs and FVs
- Builds Docker image and pushes to registry (say Dockerhub)
- Updates the Helm Chart Git repo which the image tag built in previous step
- ArgoCD: Watches the application Helm Chart git repo and rolls out changes as soon as it detects a change.
Now, since Github is a hosted service at this time we will focus on Monitoring Jenkins and ArgoCD only.
Monitoring the CI Component (Jenkins)

In order to allow Prometheus to scrape metrics off a Jenkins pod we first need to enable the Jenkins Prometheus Metrics Plugin. It can be done as following:
- Go to manage Jenkins then manage plugins and install Prometheus metrics plugin
- This plugin will expose an endpoint (default /prometheus) with metrics where a Prometheus Server can scrape data.
- You can see the output of this plugin visiting this URL: http://<JENKINS_HOST>:<JENKINS_PORT>/prometheus
Now that we have Jenkins exposing all relevant metrics. It is time to scrape them off using Prometheus. You can learn more about setting up prometheus here.
In short, Prometheus server by default looks for metrics on each pod which has the following annotation:
prometheus.io/scrape: "true"
In our case metrics are exposed at /prometheus endpoint so we need to add another annotation to let Prometheus know about that. Therefore, please add the following annotations to your Jenkins pod:
prometheus.io/scrape: "true"
prometheus.io/path: "/metrics"
Once this is done, import a new dashboard in Grafana with the id 9524, and all Jenkins metrics from the Prometheus plugin will start showing up automatically :)
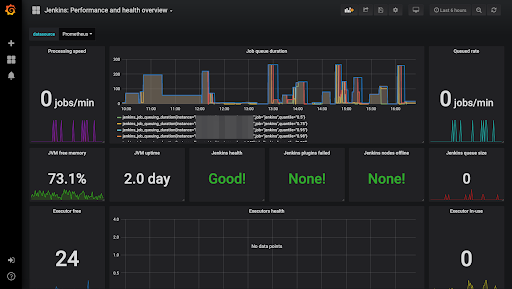
Jenkins Grafana Dashboard
The Jenkins Prometheus plugin exposes a Prometheus endpoint in Jenkins that allows Prometheus to collect Jenkins application metrics. The plugin is really just a wrapper around the Metrics plugin to expose JVM metrics through a REST endpoint that returns data in a format which Prometheus can understand.
In addition to JVM information, the plugin also exposes information about the job queue, executor counts, and other Jenkins-specific information. The Metrics plugin provides a list of the metrics exposed through the endpoint.
Since Jenkins is a JAVA based application we should carefully monitor the JVM metrics for overall Jenkins health. Some other important things to look at are: Number of executors available, Jenkins node health and build queue. A lot of information is exposed using this plugin, however you should monitor the ones which make the most sense in your use case.
Monitoring the CD Component (ArgoCD)
ArgoCD natively exposes a ton of Prometheus metrics and you need not install any plugin - the same goes for Jenkins. Some of the key metrics you'll want to watch are:
Application Metrics
Metrics about applications. Scraped at the argocd-metrics:8082/metrics endpoint.
- Gauge for application health status
- Gauge for application sync status
- Counter for application sync history
API Server Metrics
Metrics about the API Server, API requests, and response activity (request totals, response codes, etc...). Scraped at the argocd-server-metrics:8083/metrics endpoint.
However, we need to add some annotations to the ArgoCD services in order to let Prometheus discover it. This can be done as following:
kubectl -n argocd annotate service argocd-metrics prometheus.io/scrape="true"
kubectl -n argocd annotate service argocd-metrics prometheus.io/port="8082"
kubectl -n argocd annotate service argocd-server-metrics prometheus.io/scrape="true"
kubectl -n argocd annotate service argocd-server-metrics prometheus.io/port="8083"
Once you add these annotations, Prometheus should auto-discover these services and metrics will start showing up. Next step is to add the Grafana dashboard.
Navigate to the Grafana UI and import a dashboard using JSON.
You can find the dashboard JSON here. Once imported the dashboard will look something like this:
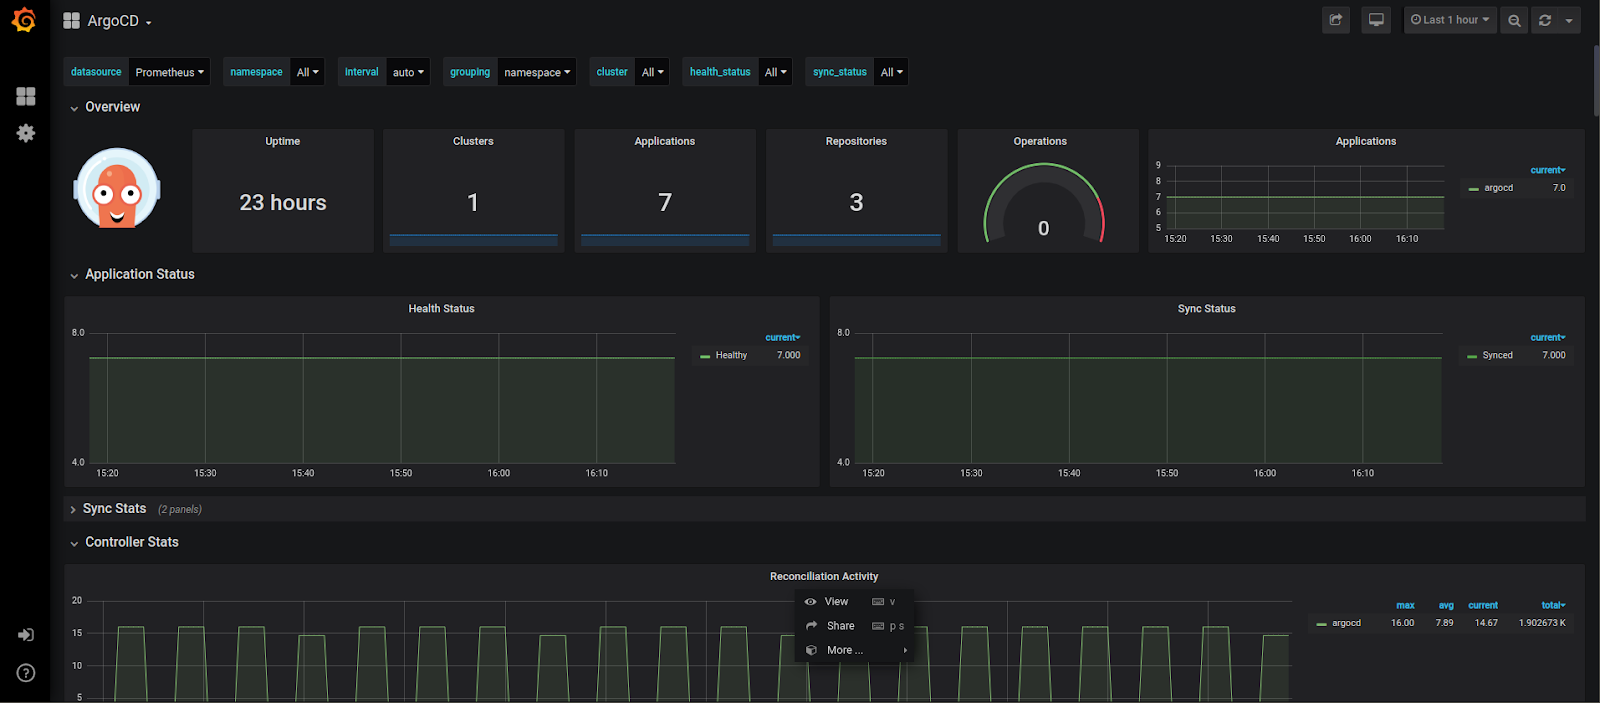
There is plenty of info on the dashboard for both the application health and ArgoCD health. Few important things to look at would be the total number of apps which are out of sync or in degraded state.
Once you have dashboards for Jenkins and ArgoCD Grafana, it is fairly easy to set-up alerts for them. Alternatively, you can also configure alerts in a Prometheus rules file and deliver them using Alertmanager.
Wrapping Up
We cannot stress enough the importance of monitoring your CI/CD pipeline. What we proposed today is just one of the solutions out there. There are plenty of other ways to do it, but using Prometheus is certainly the path of least resistance. This may simply be because it helps you monitor other workloads running in your Kubernetes clusters. You can also aggregate metrics from Prometheus instances running in different clusters by using Thanos. You can learn more about it here.
If you need help setting up these metrics feel free to reach out to myself through LinkedIn. Additionally, MetricFire can help you monitor your applications across various environments. Monitoring is extremely essential for any application stack, and you can get started with your monitoring using MetricFire’s free trial. Robust monitoring will not only help you meet SLAs for your application but also ensure a sound sleep for the operations and development teams. If you would like to learn more about it please book a demo with us.


