

Table of Contents
Great systems are not just built. They are monitored.
MetricFire is a managed observability platform that helps teams monitor production systems with clean dashboards and actionable alerts. Delivering signal, not noise. Without the operational burden of self-hosting.
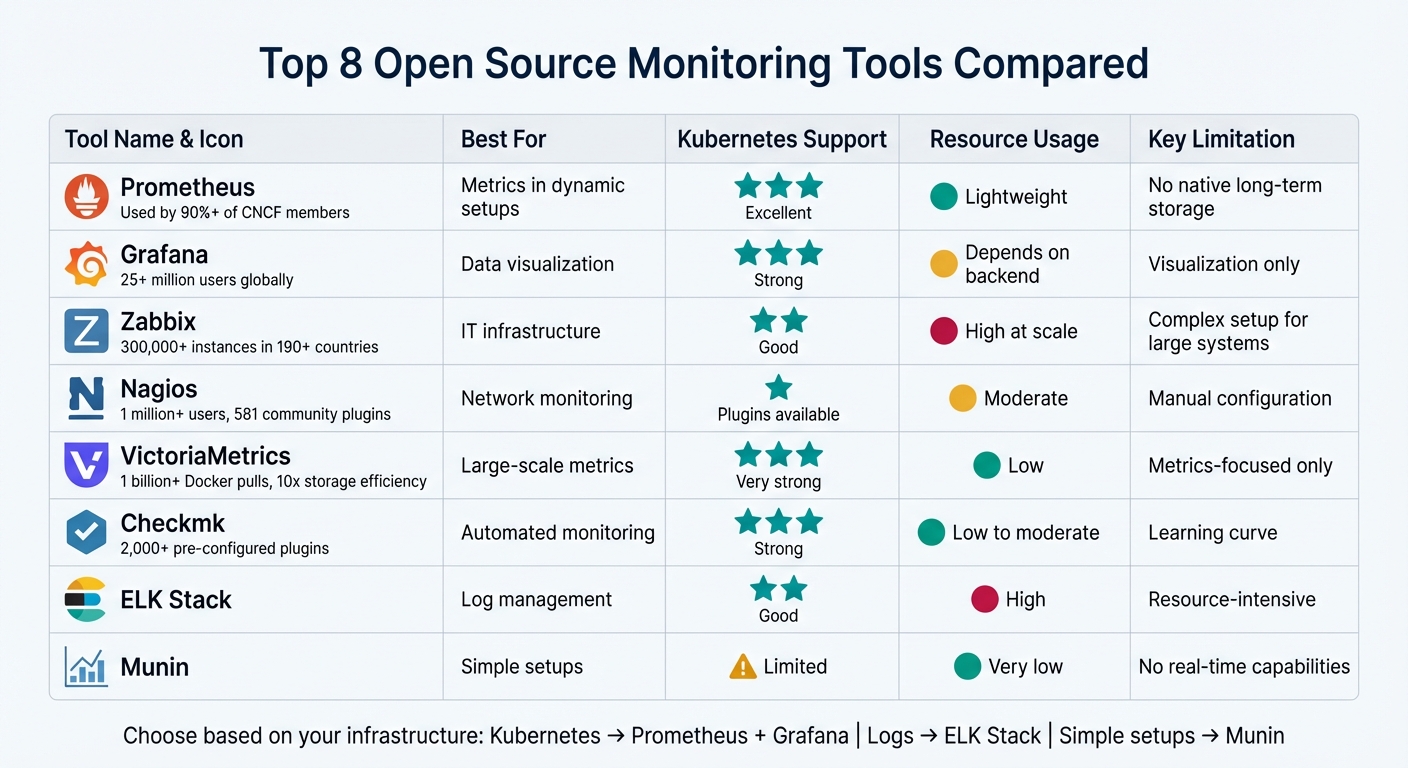
Top 8 Open Source Monitoring Tools Compared
- Prometheus: Ideal for Kubernetes monitoring with a pull-based model, efficient time-series database, and PromQL query language. Scales well but lacks built-in long-term storage.
- Grafana: The go-to for visualizing metrics from multiple sources. Works seamlessly with Prometheus but requires an external backend.
- Zabbix: Comprehensive monitoring for servers, networks, and VMs. Includes built-in visualization but can demand significant resources in large setups.
- Nagios: Reliable for network and host monitoring with a plugin-friendly architecture. Manual setup can be time-consuming.
- VictoriaMetrics: Highly efficient and scalable for metrics storage and processing. Compatible with Prometheus but focuses on metrics only.
- Checkmk: Simplifies monitoring with auto-discovery and rule-based configurations. Best for large-scale environments but has a learning curve.
- ELK Stack: Perfect for log management and full-text search. Resource-heavy and challenging to scale without expertise.
- Munin: Lightweight and simple for historical graphing but lacks modern Kubernetes support.
Quick Comparison
| Tool | Best For | Kubernetes Support | Resource Usage | Key Limitation |
|---|---|---|---|---|
| Prometheus | Metrics in dynamic setups | Excellent | Lightweight | No native long-term storage |
| Grafana | Data visualization | Strong | Depends on backend | Visualization only |
| Zabbix | IT infrastructure | Good | High at scale | Complex setup for large systems |
| Nagios | Network monitoring | Plugins available | Moderate | Manual configuration |
| VictoriaMetrics | Large-scale metrics | Very strong | Low | Metrics-focused only |
| Checkmk | Automated monitoring | Strong | Low to moderate | Learning curve |
| ELK Stack | Log management | Good | High | Resource-intensive |
| Munin | Simple setups | Limited | Very low | No real-time capabilities |
Choosing the right tool depends on your infrastructure. For monitoring Kubernetes with Prometheus and Grafana, these are top picks. For logs, ELK Stack excels. For simpler needs, Munin works well. Want help deciding? Book a demo with MetricFire today!
Open Source Monitoring Tools Comparison Chart: Features, Kubernetes Support, and Resource Usage
Nagios Core Review 2025 – Is This the Best Open-Source Monitoring Tool?
1. Prometheus
Prometheus has become a go-to solution for monitoring in cloud-native IT, with over 90% of Cloud Native Computing Foundation (CNCF) members using it. As the second project to join CNCF after Kubernetes, it was designed specifically to address the challenges posed by modern, dynamic infrastructure.
Core Features
Prometheus operates using a multi-dimensional data model, where metrics are identified by a name and key-value pairs known as labels. This setup allows for easy filtering and aggregation of data in dynamic environments. Its PromQL query language supports real-time analysis of time-series data, making it a powerful tool for troubleshooting complex systems.
Unlike traditional monitoring tools that rely on data being pushed to them, Prometheus actively pulls metrics from designated HTTP endpoints. This pull-based method simplifies service discovery and ensures quick health checks for monitored targets. Each Prometheus server operates independently, avoiding reliance on distributed storage. This independence ensures reliable monitoring, even during infrastructure outages. As highlighted in the official documentation:
Prometheus is designed for reliability, to be the system you go to during an outage to allow you to quickly diagnose problems.
Prometheus uses a highly efficient local time-series database, requiring only 1 to 2 bytes per sample. Recent updates (version 3.x) have introduced native support for the OpenTelemetry Protocol (OTLP), enabling direct metric ingestion from OpenTelemetry-instrumented applications. These features make Prometheus both scalable and well-suited for Kubernetes environments.
Scalability
Prometheus offers horizontal scalability through functional sharding, allowing monitoring to be split across services, products, or data centers. For organizations needing a centralized view across multiple clusters, federation enables a central server to aggregate data from child servers.
For long-term storage beyond the default 15-day retention period, Prometheus integrates with external backends like Thanos, VictoriaMetrics, or Cortex using its remote write feature. Additionally, the kube-prometheus-stack Helm chart provides a production-ready configuration with pre-built dashboards and alerts. This flexibility ensures Prometheus can handle the demands of large-scale Kubernetes environments.
Kubernetes Support
Prometheus shines in Kubernetes environments with its native service discovery capabilities. It automatically detects and monitors Pods, Nodes, Services, and Endpoints without requiring manual setup. This makes it particularly effective for monitoring dynamic microservices, where targets frequently change.
Resource Usage
Written in Go as a static binary, Prometheus is lightweight and efficient. However, it's important to manage high-cardinality metrics carefully. Using values like user IDs as labels can lead to increased memory usage and potentially degrade performance.
To explore how MetricFire can optimize your Prometheus deployment, consider booking a demo with their team at MetricFire Demo. They can help tailor a monitoring solution to your specific needs.
2. Grafana
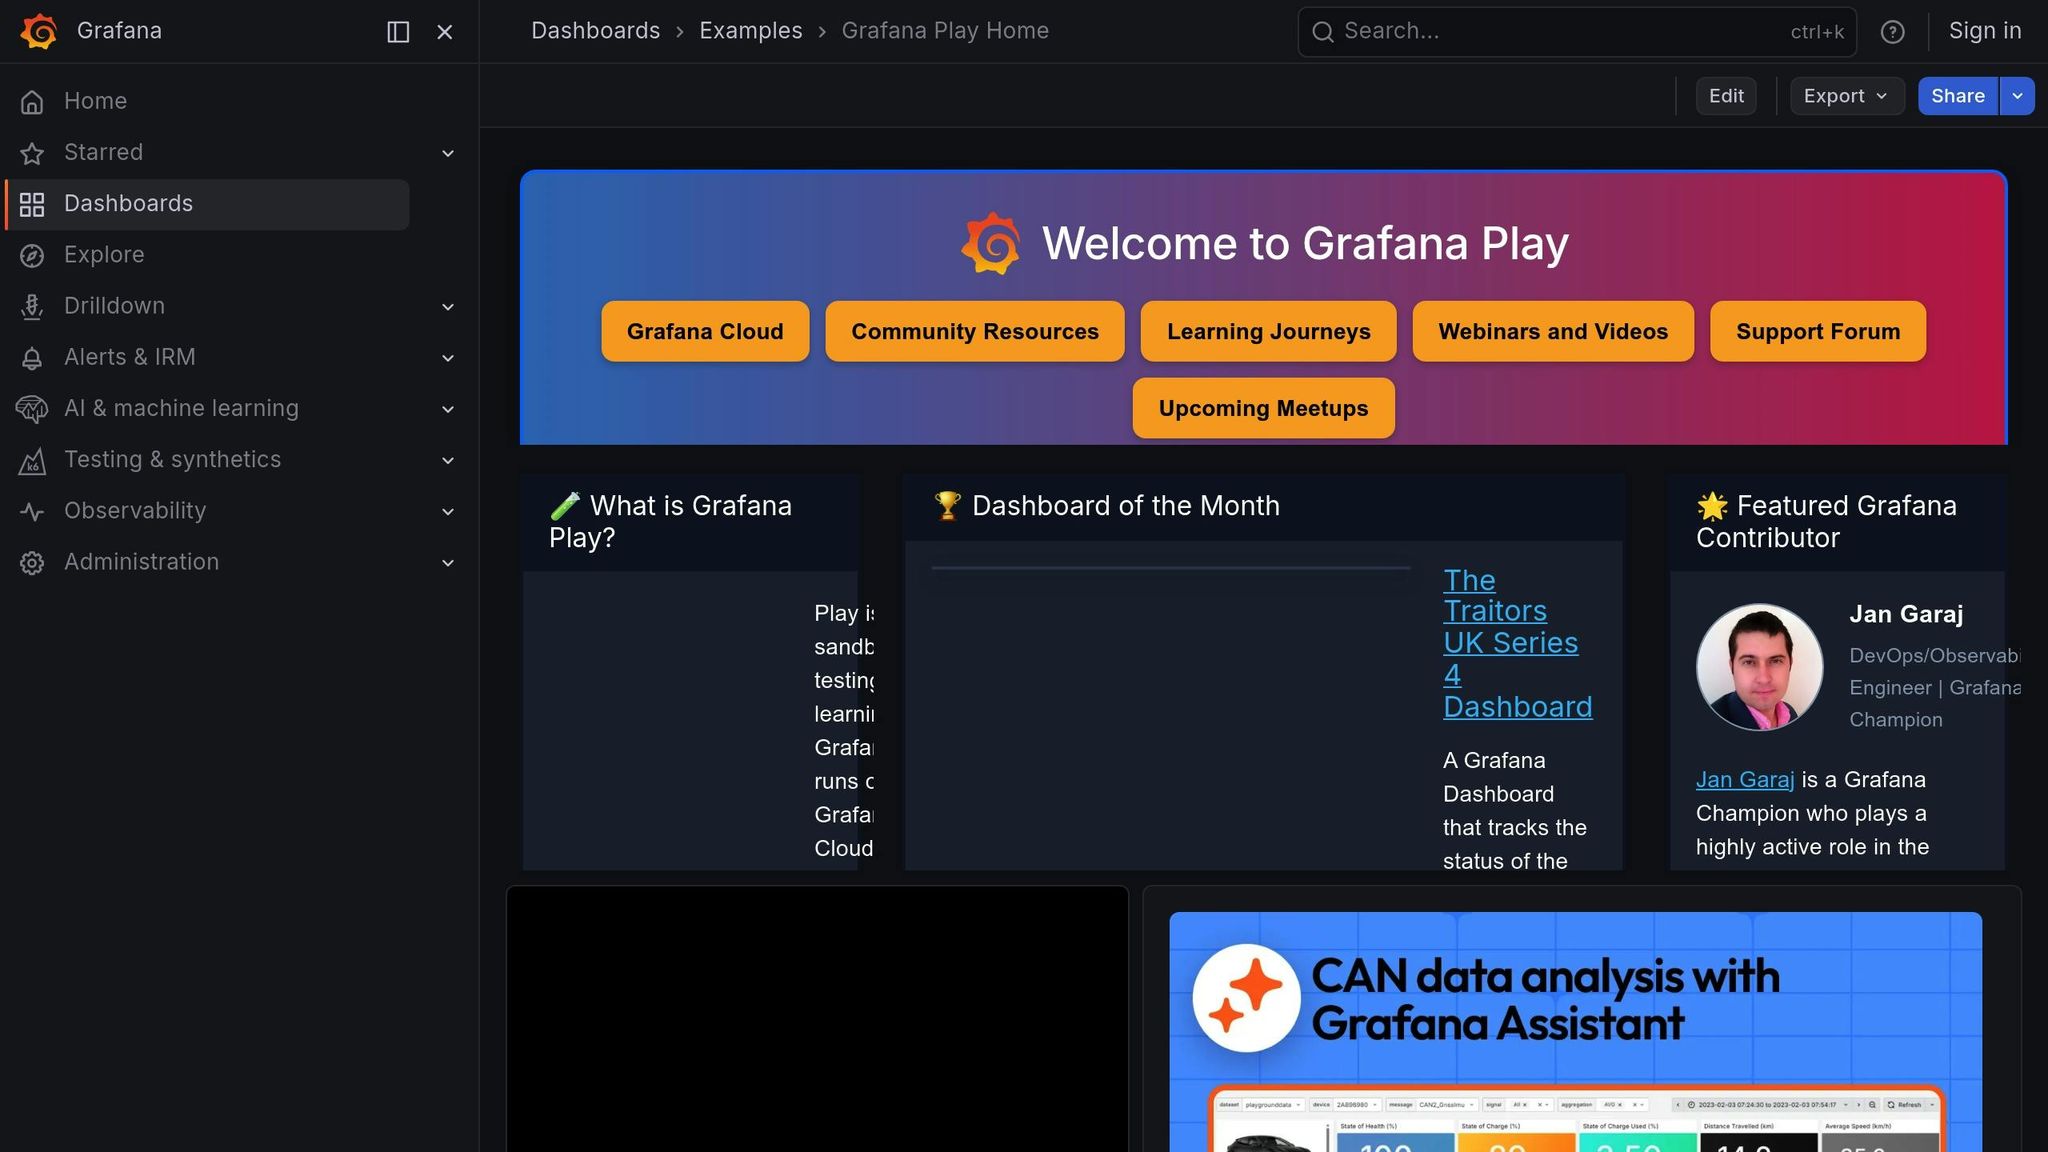
Prometheus does a stellar job of gathering metrics, but Grafana takes it a step further by turning that data into clear, actionable visuals. With over 25 million users globally, Grafana has become the go-to tool for infrastructure monitoring dashboards. As Zach Pallin, Senior DevOps Engineer at Grail, explains:
Prometheus and Grafana are now the accepted standard in the Kubernetes world, and that's what we use, too.
Core Features
Grafana excels at pulling and visualizing data from multiple sources simultaneously. Whether it's time-series databases, SQL/NoSQL systems, or even tools like Jira and ServiceNow, Grafana connects seamlessly. Its Explore Mode lets users compare different time ranges side-by-side, making troubleshooting faster and easier.
With dashboard variables, teams can reuse templates across environments, avoiding hard-coded values. Its alerting system integrates with platforms like Slack, PagerDuty, email, or SMS, ensuring notifications reach the right people when issues arise. For example, in 2025, The Trade Desk incorporated on-call notifications directly into Grafana dashboards. Nathan Bellowe, Staff Software Engineer, shared:
Getting on-call notifications and paging integrated closer to the dashboards and data that help developers diagnose and resolve issues will greatly improve on-call workflows.
Grafana also allows provisioning with JSON or YAML files, making version control and automated deployments straightforward. The "Grafana Assistant" is a newer feature that leverages AI to help users build dashboards and write queries without needing advanced PromQL expertise. Its flexibility ensures it can grow alongside your infrastructure.
Scalability
While Grafana itself is lightweight, scalability is tied to the backend systems managing the data, such as Prometheus, Mimir, or Loki. For larger setups, Grafana offers a horizontally scalable architecture capable of handling significant data volumes. The LGTM stack - Loki for logs, Grafana for visualization, Tempo for traces, and Mimir for metrics - delivers a complete observability solution.
In 2025, Mux implemented Adaptive Telemetry to reduce unused metrics and lower cardinality, achieving notable cost reductions. However, self-hosting the entire stack can require considerable operational effort. Despite this, Grafana’s scalability fits perfectly into modern containerized environments.
Kubernetes Support
Grafana shines in Kubernetes monitoring, offering dashboards tailored for cluster health, pod-level alerts, and resource usage. By integrating with Grafana Loki for log aggregation, it correlates metrics with logs, simplifying root cause analysis without switching tools.
The platform detects issues early, like CPU throttling or network saturation, and identifies outlier pods. It even tracks Kubernetes costs - covering nodes, load balancers, and persistent volumes - while offering future cost projections to help manage budgets. Austin Adams, Senior Software Engineer at Ygrene, put it simply:
I can't really live without Prometheus and Grafana. I really love being able to see everything that's happening in my applications.
Resource Usage
Although Grafana itself is lightweight, the overall resource demand depends on the backend storage systems. High-cardinality data can slow performance if the backend isn't optimized for real-time analytics. Grafana Cloud’s free tier includes 10,000 Prometheus metric series and 50GB each for logs, traces, and profiles, making it a great starting point for smaller projects with room to scale.
3. Zabbix
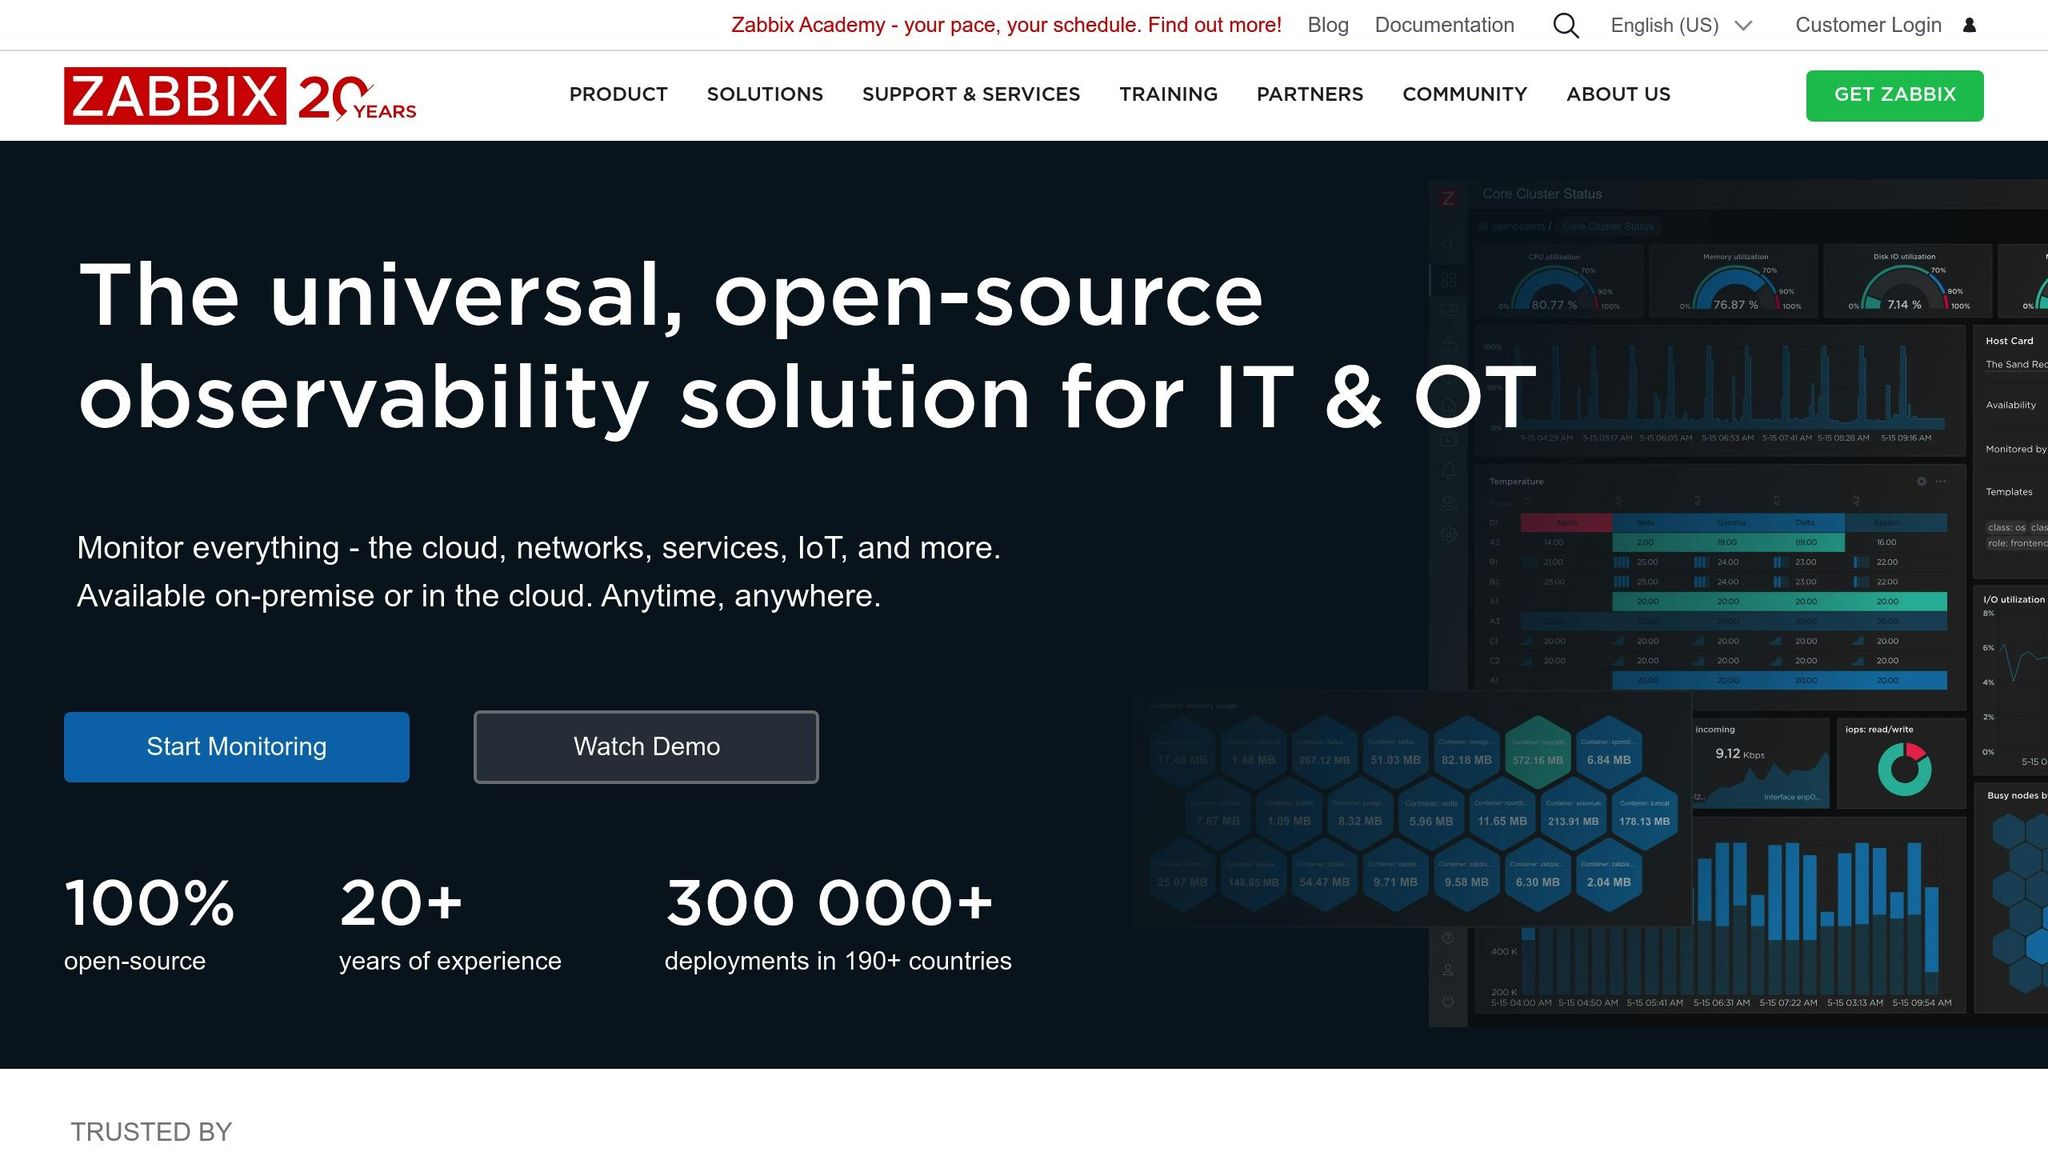
Zabbix is a comprehensive monitoring platform with over two decades of experience. Deployed in more than 300,000 instances across 190+ countries, it’s designed primarily for traditional IT setups like servers, network devices, and virtual machines. However, it also adapts to modern needs, such as containerized environments, making it a solid choice for both legacy systems and newer infrastructures.
Core Features
Zabbix gathers metrics using a high-performance agent, agentless methods (like SNMP, IPMI, JMX, and ODBC), and synthetic monitoring. It can collect data as frequently as every second, making it suitable for systems requiring intensive monitoring.
Its "Triggers" feature is key for detecting issues. These triggers use smart thresholds, trend analysis, and anomaly detection based on historical data, ensuring a proactive approach to problem-solving. Zabbix’s escalation engine automates workflows and can even self-correct issues, like restarting services via remote scripts. One engineering director in the travel and hospitality industry shared their praise:
"Zabbix is without a doubt the most powerful and versatile monitoring platform available".
For visualization, Zabbix provides integrated dashboards that consolidate diverse data into a single view. Unlike Prometheus, which often requires external tools, Zabbix includes built-in visualization capabilities.
Scalability
Zabbix uses local proxies to scale efficiently, gathering data for its central server. Native high availability is supported in servers (starting from version 6.0) and proxies (from version 7.0). A notable example is the European Space Agency, which uses Zabbix to monitor the Columbus lab aboard the International Space Station, leveraging real-time tracking and automated discovery.
However, its reliance on relational databases like MySQL or PostgreSQL can become demanding in large-scale deployments. For instance, QU!CK Scan & Go implemented Zabbix to monitor stores 24/7, reducing perishable product losses by 75% by predicting power outages and enabling timely action.
These scalability features also allow Zabbix to handle dynamic environments such as Kubernetes effectively.
Kubernetes Support
Zabbix automatically detects and monitors Kubernetes nodes, pods, and critical components like kube-apiserver, kube-scheduler, kube-controller-manager, and kubelet. It also supports Docker and Podman containers right out of the box. While its Low-Level Discovery (LLD) works well for static resources, dynamic container environments may require manual configuration.
Resource Usage
Zabbix is designed to minimize its impact on monitored hosts. The Zabbix Agent has an almost negligible performance footprint. However, its central server and relational database can require significant resources in larger setups. Professional support is highly responsive, with an average response time of 12 minutes. Best of all, Zabbix is completely free, with no licensing fees.
Curious about how Zabbix can improve your IT monitoring? Schedule a demo with the MetricFire team: https://www.metricfire.com/demo/.
4. Nagios
Nagios has been around for over two decades, serving more than a million users worldwide. Its longevity and robust ecosystem - featuring 50 official plugins and 581 community add-ons - make it a trusted choice for monitoring diverse environments. With a mix of legacy system compatibility and modern adaptability, Nagios ensures thorough monitoring across various setups.
Core Features
Nagios provides monitoring for network services like SMTP, HTTP, SNMP, FTP, and SSH, alongside protocols such as TCP, UDP, and ICMP. It also tracks host resources, including CPU load, disk usage, memory, and system logs. Its plugin-friendly architecture allows users to create custom checks in languages like Bash, Python, Perl, or C. As Nagios puts it: "If you can check it with a script, you can monitor it with Nagios".
The platform’s alerting system delivers notifications through email, SMS, or custom scripts, and it incorporates advanced features like escalation paths and flap detection for recurring issues. Event handlers can automatically restart services or run scripts to address problems before they escalate. Additionally, its network hierarchy tools help differentiate between hosts that are genuinely down and those that are simply unreachable.
Scalability
Nagios handles large-scale environments with distributed monitoring setups and the Mod-Gearman add-on, which improves performance by parallelizing checks and offloading execution tasks. For centralized oversight, Nagios Fusion allows monitoring to be spread across remote servers without overwhelming a single node. However, using Nagios Core for extensive deployments can be labor-intensive, as it requires manual configuration and lacks built-in enterprise-grade features. Despite these challenges, its scalable design extends to modern containerized environments.
Kubernetes Support
Nagios supports monitoring Kubernetes clusters and containerized applications through specialized plugins available on the Nagios Exchange. It also tracks cloud resources across platforms like AWS, Azure, and Google Cloud, offering custom metrics monitoring through scripts. For more advanced visualization, Nagios integrates with Kubernetes-native tools by exporting performance data to Prometheus and Grafana.
Resource Usage
Nagios minimizes resource consumption with a lightweight scheduler that efficiently dispatches signals to plugins and executes checks in parallel. Features like automatic log rotation further enhance performance. While Nagios Core is free under the GPL license, Nagios XI - the enterprise edition - provides an enhanced user interface and access to professional support.
If you're curious about how Nagios can meet your monitoring needs, you can book a demo with the MetricFire team at this link.
5. VictoriaMetrics
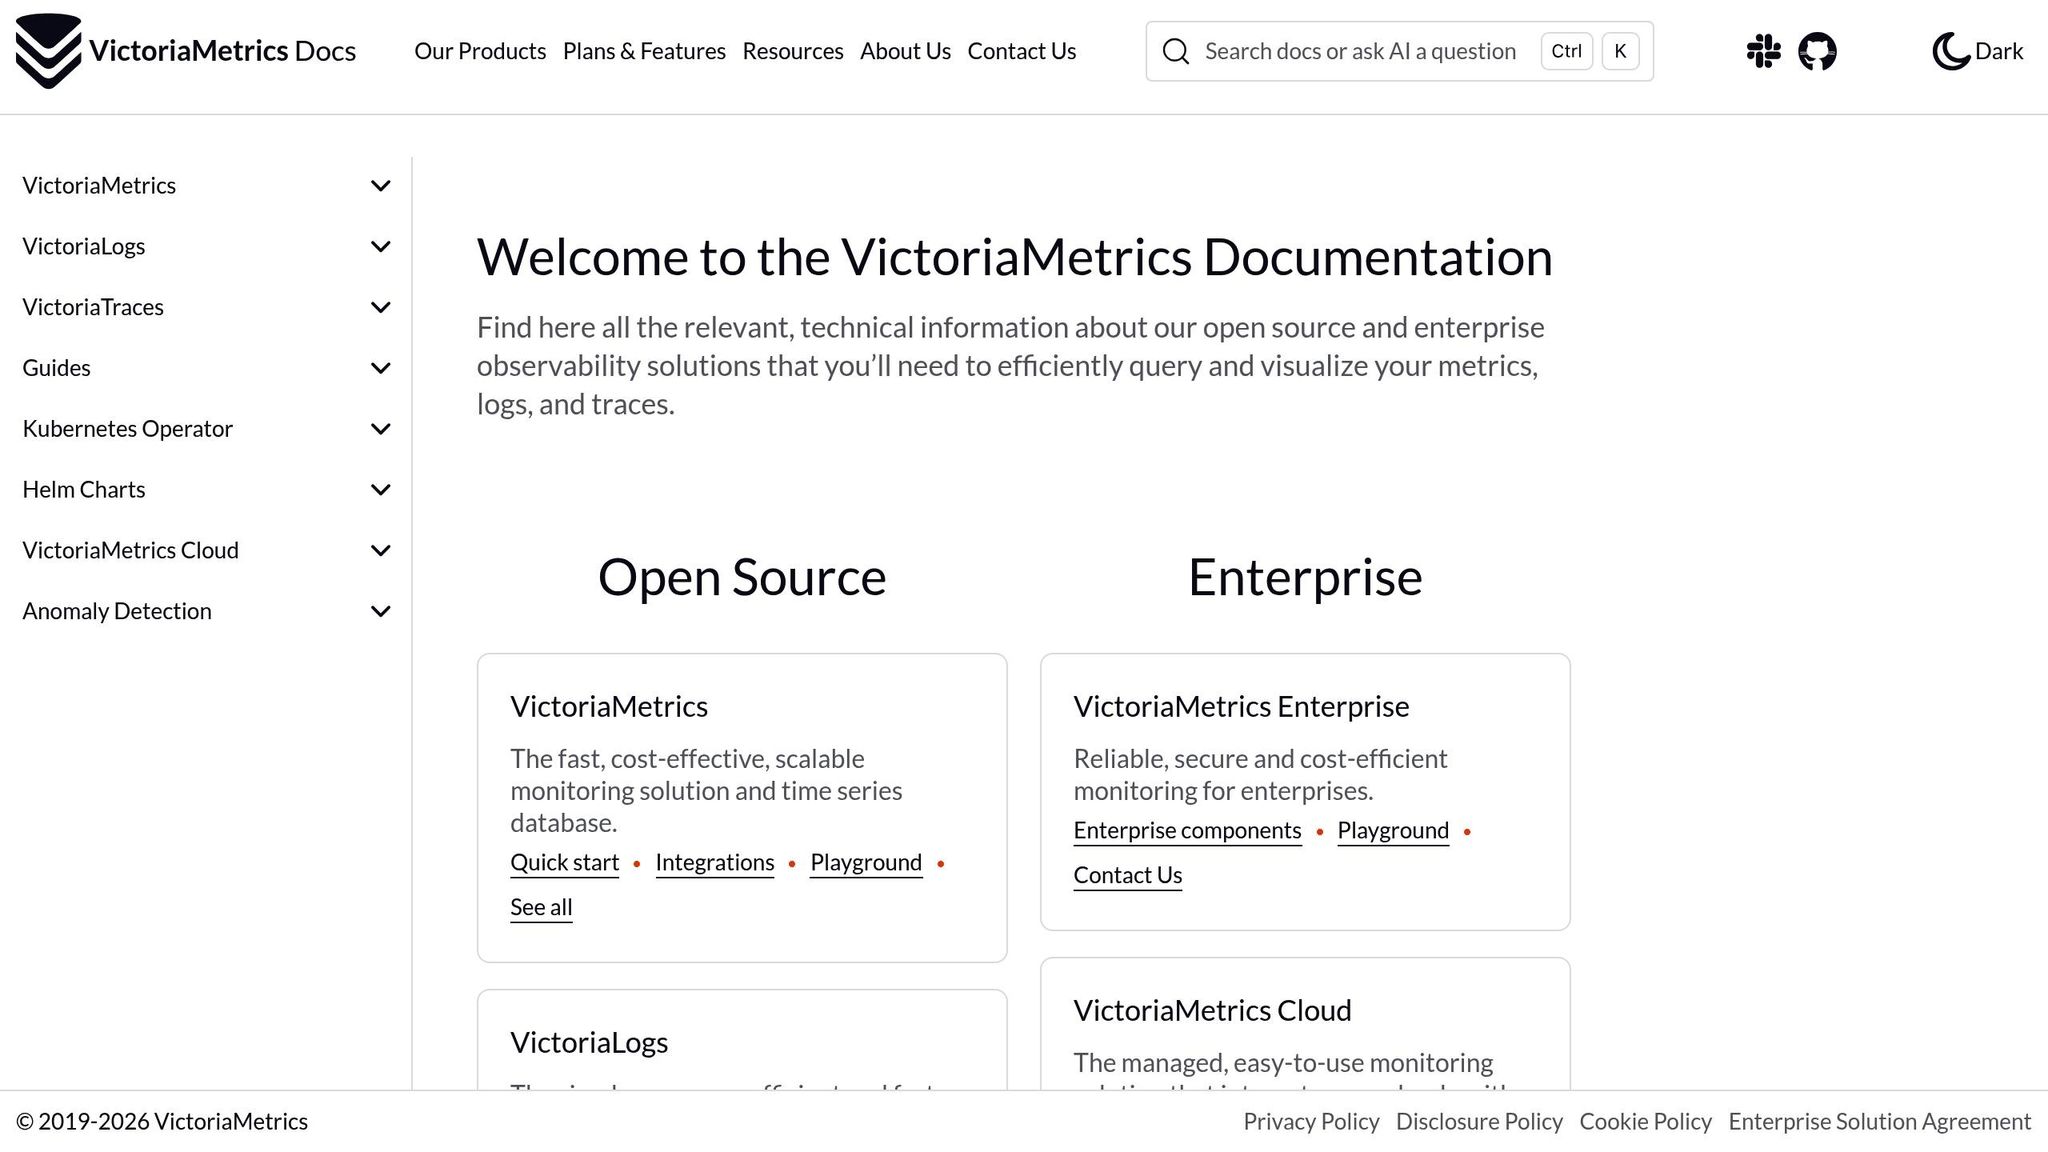
VictoriaMetrics has made a name for itself in the monitoring world, boasting over 1 billion Docker pulls and 19 million GitHub downloads as of early 2026. Its key advantage lies in its efficiency - it can store up to 10 times more data using the same computing and storage resources compared to other tools. This means users can significantly cut costs without compromising performance.
Core Features
VictoriaMetrics supports both pull-based (like Prometheus) and push-based (such as Graphite, InfluxDB, OpenTSDB, CSV, and JSON) data collection, making it adaptable to a variety of monitoring setups. It uses MetricsQL, a query language compatible with PromQL but designed for better performance and more advanced time-series analysis features. The single-node version is lightweight, provided as a standalone binary without external dependencies, which makes deployment straightforward. Additional capabilities include data deduplication from high-availability setups and unlimited backfilling of historical data.
Scalability
VictoriaMetrics is built to handle demanding environments. A single-node instance can manage up to 100 million active time series and process 2 million samples per second. For even larger workloads, the cluster version scales horizontally to handle billions of active series and hundreds of millions of samples per second. It also supports multi-tenancy with separate namespaces and built-in data replication, making it a robust choice for enterprise-grade monitoring.
Companies like Grammarly have showcased the platform's efficiency. During a proof-of-concept trial, Grammarly Engineering transitioned to VictoriaMetrics and reduced their AWS monitoring costs by a factor of 10. Granulate, another user, reported a fivefold reduction in metrics storage costs while managing large volumes on modest hardware.
"Due to VictoriaMetrics' high optimization features, it handles our volume of time series on relatively modest hardware, reducing our costs of metrics storage by approximately five times."
– Timothy Sleptsov, Senior Software Engineer, Granulate
Kubernetes Support
VictoriaMetrics integrates seamlessly with Kubernetes, thanks to its dedicated vmoperator. This operator automates the provisioning, scaling, and management of monitoring components. It supports Kubernetes-native configurations using Custom Resource Definitions like VMServiceScrape, VMPodScrape, and VMRule. Helm charts are available for easier setup, and the platform remains compatible with Prometheus-style service discovery and scraping configurations. Additionally, it supports the Horizontal Pod Autoscaler (HPA) for dynamic scaling of cluster storage, making it a natural fit for containerized environments.
Resource Usage
One of VictoriaMetrics' standout qualities is its low resource consumption. It uses up to 10 times less RAM than InfluxDB and up to 7 times less than Prometheus, Thanos, or Cortex. Its compression algorithms reduce storage requirements dramatically - up to 70 times smaller than TimescaleDB for the same dataset, or 3 times smaller even when TimescaleDB is heavily optimized. This efficiency makes it an ideal choice for complex IT environments where resources are at a premium.
Both the single-node and cluster versions are free and open source under the Apache 2.0 license. For those needing more advanced features like downsampling, multiple retention periods, or anomaly detection, an enterprise version is available. VictoriaMetrics also offers a fully managed cloud service on AWS.
Book a demo with MetricFire to see how VictoriaMetrics can transform your monitoring setup.
6. Checkmk
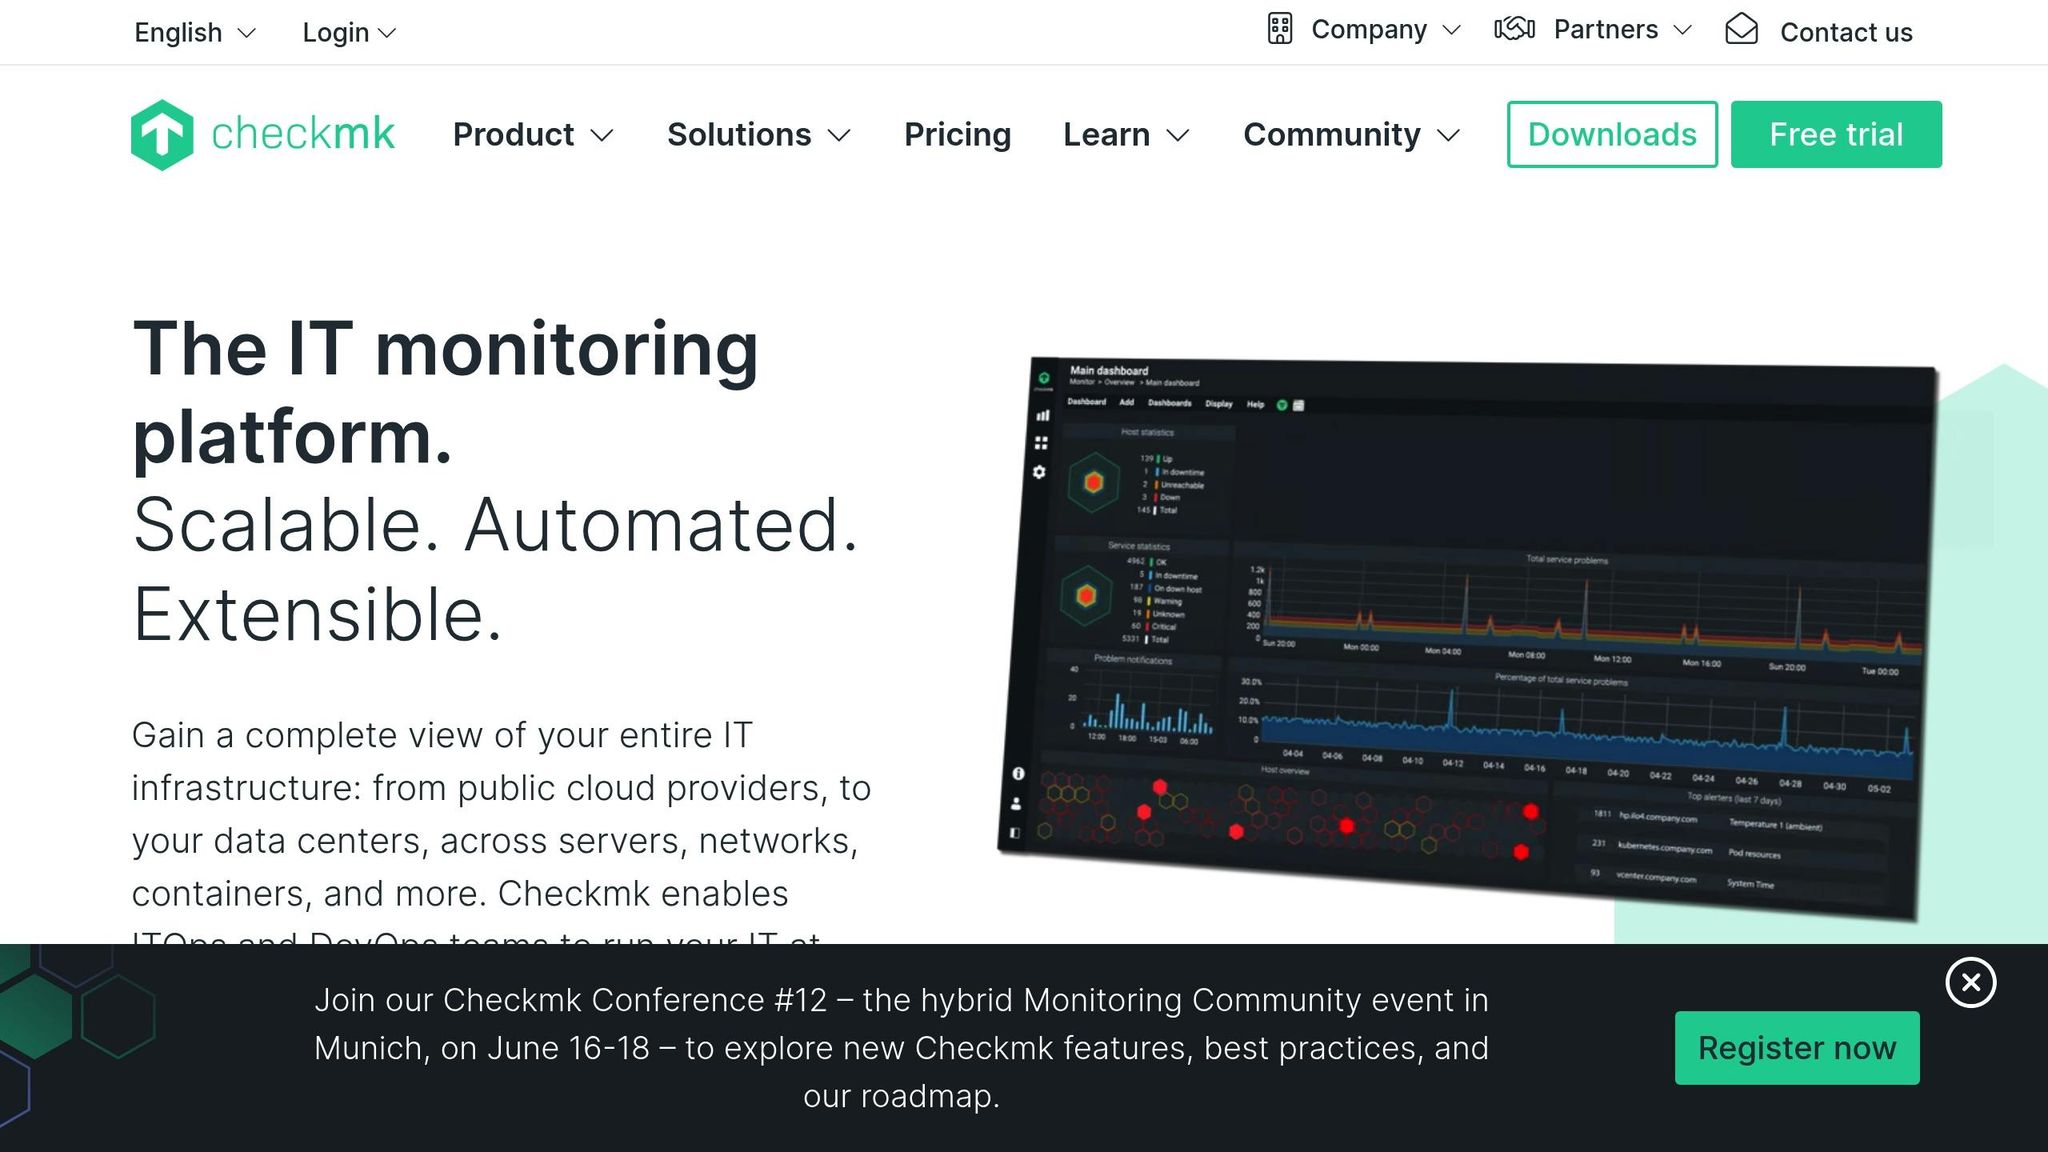
Checkmk stands out for its focus on automation and simplicity. With over 2,000 pre-configured plug-ins ready to go, it covers servers, networks, applications, and cloud environments effortlessly. Its auto-discovery feature identifies infrastructure components and suggests relevant metrics and thresholds, minimizing the need for manual setup.
Core Features
Checkmk uses a rule-based configuration system that simplifies managing complex environments. Administrators can apply changes across multiple hosts with intuitive rules. The platform also includes an Event Console, which processes Syslog messages, SNMP traps, and log files to detect issues that might not appear in standard metrics. Its Business Intelligence module organizes application dependencies into a single health overview, making it easier to see how services impact critical business operations.
Scalability
Checkmk is designed to handle large-scale environments with ease. Its distributed master-site architecture supports hundreds of locations and monitors millions of services. The Enterprise Edition's Checkmk Micro Core (CMC) delivers exceptional CPU efficiency and allows for 1-second measurement intervals, a significant improvement over the 60-second default in the open-source Raw Edition.
| Feature | Checkmk Raw (Open Source) | Checkmk Enterprise |
|---|---|---|
| Monitoring Core | Nagios | Checkmk Micro Core (CMC) |
| CPU Efficiency | Medium | Very High |
| Measurement Interval | 60s | 1s |
| Agent Management | Manual | Automated (Agent Bakery) |
Kubernetes Support
Checkmk extends its functionality to containerized environments, with a major overhaul introduced in version 2.1.0. Following tips for monitoring Kubernetes applications can help optimize these setups. It employs a two-part system: a Special Agent retrieves metadata via the API server, while Node and Cluster Collectors (deployed through Helm) gather detailed CPU and memory metrics at deployment and DaemonSet levels. The platform supports Vanilla Kubernetes, Amazon EKS, Azure AKS, Google GKE (including Autopilot), OpenShift, and Tanzu. Dynamic Host Management further simplifies operations by automatically adding or removing containers and pods as they come online or shut down.
Resource Usage
Checkmk agents are lightweight, requiring minimal CPU, RAM, and storage, which helps keep resource demands low. Users on G2 rate its Ease of Setup at 8.7/10 and Quality of Support at 8.9/10, reflecting its focus on reducing administrative effort. The open-source Raw Edition is free under the GPL v2 license, while the Enterprise Edition starts at around $660.
Interested in seeing Checkmk in action? Book a demo at MetricFire (https://www.metricfire.com/demo/).
7. ELK Stack
The ELK Stack - Elasticsearch, Logstash, and Kibana - is widely recognized as one of the most popular platforms for log management. This system brings together a distributed search engine, a data processing pipeline, and a visualization interface into a single, integrated solution. To enhance its capabilities, it also includes Beats, lightweight data shippers, and Elastic Agent, which supports unified monitoring for over 200 systems. The stack stands out for its ability to handle full-text searches across massive log datasets efficiently, using Apache Lucene to process terabytes of data with impressive speed. This makes it a strong complement to the metric-focused tools discussed earlier.
Core Features
At the heart of the ELK Stack is Elasticsearch, which serves as the centralized data store, indexing and searching logs and metrics stored in JSON format. Logstash works as the data pipeline, ingesting data from various sources, transforming it with filters like Grok, and routing it to Elasticsearch. Kibana provides the visualization component, allowing users to create dashboards, heatmaps, and time-series analyses. Meanwhile, Beats, such as Filebeat for log collection and Metricbeat for system metrics, operate on edge hosts with minimal resource use, forwarding data directly to Elasticsearch or via Logstash for further processing.
Scalability
The ELK Stack is designed to manage vast amounts of unstructured data, with scalability achieved through horizontal expansion. Elasticsearch splits its indices into shards, distributing data and operations across multiple nodes. High availability is ensured by creating replicas - copies of shards stored on separate nodes to safeguard against data loss during hardware failures. The system can manage petabytes of data, but scaling requires manual intervention, such as configuring shards, managing nodes, and performing upgrades. To handle complex pipelines or ingestion spikes, many organizations integrate message brokers like Kafka or RabbitMQ between data shippers and Elasticsearch. Performance at scale is heavily influenced by disk I/O and proper JVM tuning, with Elasticsearch 7.x introducing a real memory circuit breaker to enhance cluster stability under heavy loads.
Kubernetes Support
The ELK Stack also supports monitoring Kubernetes, making it a versatile tool for modern environments. Filebeat handles pod and container logs, while Metricbeat collects system metrics and data from the Kubelet API and kube-state-metrics. Both tools feature hints-based autodiscovery, automatically detecting new components in pods and applying the appropriate logging or metric configurations. The add_kubernetes_metadata processor enriches events with details like pod IDs, container names, and node information, simplifying data correlation. Deployment options include Kubernetes Operators (Elastic Cloud on Kubernetes - ECK), Helm charts, and standard YAML manifests. Beats can be deployed as DaemonSets to monitor each node, and leader election can be used for cluster-wide metrics to prevent duplication.
Resource Usage
While Beats are lightweight and consume minimal resources, Logstash and Elasticsearch require more substantial hardware. Elasticsearch is particularly demanding, requiring significant memory and disk resources, while Logstash, which runs on the JVM, has medium to high CPU and memory requirements. The introduction of a Java execution engine in Logstash 7.x helped reduce memory consumption compared to older Ruby-based versions. Although the core software is open-source or available under the Elastic License, the overall cost of ownership can be high due to infrastructure needs and the expertise required for maintenance. After Elastic's 2021 licensing change to SSPL and Elastic License for versions 7.11 and later, many users migrated to OpenSearch, a fully open-source fork under the Apache 2.0 license.
For more information or to discuss your monitoring needs, you can book a demo with the MetricFire team here: https://www.metricfire.com/demo/.
8. Munin
Munin is a straightforward monitoring platform designed to track resource trends effectively. First released in 2002, it continues to receive updates, with version 2.0.69 released in late 2021. Munin excels in historical graphing and capacity planning, offering visual insights into system performance. It operates under the GNU General Public License and is completely free to use.
Core Features
Munin uses a master/node architecture, polling nodes every 5 minutes to gather performance metrics. It relies on RRDtool (Round Robin Database) for storing data and generating graphs. One of its standout features is its extensive plugin ecosystem, boasting over 500 plugins for monitoring a variety of services and infrastructure components. These plugins, which can be written in any programming language, simplify monitoring for standard server metrics like CPU, memory, and disk usage.
Scalability
Munin is particularly well-suited for small-to-medium infrastructures. Its modular plugin system allows it to scale efficiently in these environments, but it’s not designed for large-scale, high-churn setups. According to Munin Monitoring, the platform can handle installations ranging from a home Raspberry Pi to clusters with over 100 nodes. However, its focus on historical graphing rather than real-time, high-cardinality data processing makes it less ideal for cloud-native or dynamic containerized environments. For organizations needing enterprise-level outage notifications or high availability, pairing Munin with additional monitoring tools might be necessary.
Kubernetes Support
Munin lacks native support for Kubernetes monitoring and is better classified as a traditional infrastructure monitoring tool rather than a cloud-native observability solution. Unlike modern platforms that offer seamless Kubernetes integration, Munin relies on its polling-based architecture for monitoring networked resources. For those needing detailed Kubernetes visibility, other cloud-native tools like Grafana and Prometheus are likely a better fit.
While Munin is excellent for traditional setups, its approach differs significantly from the modern, cloud-native solutions discussed earlier.
Resource Usage
Munin is lightweight and can operate on low-power devices like a Raspberry Pi. Its 5-minute polling interval minimizes resource usage, making it a great option for environments prioritizing ease of installation and clear resource visualization.
If you're exploring monitoring solutions, you can schedule a demo with the MetricFire team at MetricFire.
Strengths and Weaknesses
Each monitoring tool has its own advantages and drawbacks, making the best choice dependent on your specific infrastructure needs.
Prometheus is a standout for Kubernetes environments, thanks to its native service discovery and robust query language. However, it falls short with no built-in long-term storage and lacks native support for logs or traces.
Grafana is the go-to for creating visually appealing dashboards across various data sources. That said, it's purely a visualization tool and relies on an external backend for data collection.
For traditional setups, Zabbix and Nagios Core are solid options. Zabbix provides an all-in-one monitoring suite with strong SNMP and IPMI support, capable of scaling to over 100,000 devices. Its downsides include a steep learning curve - teams may need 6–8 weeks to master it - and potential SQL database bottlenecks in high-churn cloud environments. Nagios is known for its reliability and an extensive library of community plugins, but its outdated interface and text-file-based configurations can make setup cumbersome. Enterprise deployments often take 8–12 weeks.
VictoriaMetrics offers exceptional performance for large-scale metrics, using minimal resources while maintaining Prometheus compatibility. However, like Prometheus, it requires additional tools for logs and traces. Checkmk provides advanced agent management and auto-discovery, making it a strong choice for server monitoring, though its steep learning curve could slow down initial deployment.
The ELK Stack (Elasticsearch, Logstash, Kibana) is a top pick for log aggregation and full-text search. As Ivan Tarin from SUSE explains:
Open source monitoring tools eliminate licensing fees... but you're responsible for applying patches, managing updates and resolving any technical issues.
While powerful, ELK is resource-heavy and can be challenging to scale effectively.
Conclusion
Choosing the best open-source monitoring tool hinges on matching your infrastructure's needs with the specific strengths of each tool. For Kubernetes and cloud-native setups, Prometheus stands out as a go-to option due to its built-in service discovery and efficient data model. Following best practices for monitoring Kubernetes with Grafana can further enhance this setup. When combined with Grafana for visualization and extended by tools like VictoriaMetrics or Thanos for long-term data storage, it becomes a powerful solution for dynamic, evolving environments.
On the other hand, traditional IT infrastructures, which often include physical devices and legacy systems, benefit more from tools like Zabbix or Nagios Core. Zabbix excels with features like built-in SNMP and IPMI support, making it ideal for monitoring physical assets. Nagios, with its extensive plugin ecosystem, offers flexibility for a variety of use cases. For hybrid environments, a practical approach might involve using Zabbix to monitor network and on-premise assets while leveraging Prometheus for applications and containerized services.
For smaller-scale deployments, Munin provides a simple setup and quick visibility with minimal configuration. Meanwhile, teams prioritizing log analysis and troubleshooting may find the ELK Stack appealing, though they should account for the resources and expertise required to scale it effectively.
As infrastructure demands grow, monitoring strategies are evolving too. The trend is moving toward OpenTelemetry-native tools that integrate metrics, logs, and traces into a unified platform. For instance, Prometheus 3.x now supports native OTLP ingest, and Zabbix plans to incorporate OpenTelemetry in its 8.0 release slated for 2026. These advancements promise to simplify monitoring workflows and speed up root-cause analysis.
If you're looking for a tailored monitoring solution, consider booking a demo with MetricFire to find the right fit for your infrastructure.
FAQs
Which tool should I choose for Kubernetes monitoring?
Prometheus is the go-to open-source tool for monitoring Kubernetes. Built specifically for dynamic and distributed systems, it excels at managing high-cardinality data and delivering real-time metrics. Plus, it pairs effortlessly with Grafana, enabling more advanced and visually appealing dashboards. While there are other tools available for Kubernetes monitoring, Prometheus shines due to its reliability, deep integration with Kubernetes, and a thriving community of users and contributors. This makes it a solid choice for production-level environments.
How do I add long-term storage to Prometheus?
To keep Prometheus data for the long haul, you can set up remote write to transfer data to external storage systems such as InfluxDB, TimescaleDB, or cloud options like S3 and Azure Blob. Alternatively, tools like Thanos, Cortex, or Grafana Mimir can expand Prometheus’s storage functionality. These options allow for scalable storage, extended retention, and flexible query access, depending on what works best for your setup.
Do I need separate tools for metrics and logs?
Whether or not you need separate tools really comes down to your infrastructure setup and how you approach observability. These days, plenty of platforms combine metrics and logs into a single system, complete with integrated dashboards. But some organizations still opt for specialized tools - like Prometheus for metrics and the ELK Stack for logs - to fine-tune performance. The decision ultimately hinges on factors like the size of your system, how complex it is, and how much integration you want.