
Table of Contents
Great systems are not just built. They are monitored.
MetricFire is a managed observability platform that helps teams monitor production systems with clean dashboards and actionable alerts. Delivering signal, not noise. Without the operational burden of self-hosting.
Graphite Storage Optimization: Best Practices
Graphite monitoring systems can quickly become costly as the number of unique metrics grows. The real expense comes from storage demands created by high cardinality (i.e., too many unique time-series combinations) and redundant data. Here’s what you need to know to control costs and improve efficiency:
- Metric Tagging: Tags help differentiate data but can inflate storage needs if not managed wisely.
- Redundancy: Most Graphite setups store three copies of data for fault tolerance, tripling storage use.
- Whisper Database: Fixed-size files and default settings lead to wasted space if not fine-tuned.
- Retention Policies: Use tiered retention (short-term high resolution, long-term low resolution) to save space.
- Aggregation: Downsample older data to reduce storage while keeping trends intact.
- Filtering: Drop unnecessary metrics upstream using tools like
carbon-relay-ngto prevent waste.
By adjusting retention periods, aggregating data, and filtering metrics, you can cut costs by up to 50%. Tools like carbon-cache and carbon-aggregator also help reduce I/O strain, and managed services like MetricFire can simplify scaling for large setups.
[banner_cta title=“Sign up for a Demo!” text=“Get Hosted Graphite by MetricFire free for 14 days. No credit card required.“]
Common Graphite Storage Problems
Graphite’s design comes with several storage challenges that can quickly drive up costs and complicate operations. By understanding these issues, you can tackle them early and set the stage for more efficient solutions.
How Metrics Grow Over Time
When you’re ingesting high-frequency data, disk space fills up fast. Sending metrics every few seconds forces Graphite’s Whisper database to store all those data points within your retention window. Here’s the catch: Whisper relies on fixed-size, pre-allocated files. That means disk space is consumed the moment a metric is created, regardless of how much data it actually holds.
The problem grows worse with high cardinality. For instance, using tags or nested metric prefixes (like tracking per-core CPU metrics across thousands of servers) generates a large number of distinct time series. Each of these series requires its own file, creating I/O bottlenecks as Graphite’s carbon-cache.py flushes buffered data to thousands of files simultaneously.
Whisper’s design also adds extra overhead. Unlike some databases that calculate timestamps from position, Whisper stores a timestamp with every data point to ensure validity. This increases the storage needed for each point. Plus, if you configure multiple archives - for example, one with 1-minute resolution for a day and another with 10-minute resolution for a month - Whisper writes data to all archives at the same time, leading to redundant storage.
Why Default Settings Increase Costs
Graphite’s default settings often contribute to inefficiencies. Long, high-resolution retention periods are standard, and since Whisper pre-allocates space based on the highest precision and longest retention, this can lead to wasted disk space. Metrics that don’t need high granularity still end up consuming significant storage, with overlapping data and empty time slots adding to the inefficiency.
Making changes to storage-schemas.conf only impacts new metrics, meaning you’ll need to manually resize existing .wsp files to reflect updates. On top of that, many systems default to a maximum of 1,024 file descriptors, but a typical Graphite setup might need 8,192 or more to handle the I/O load. Without proper tuning, you’ll encounter “Too many open files” errors as the number of metrics grows.
The next section will dive into aggregate your metrics and downsampling strategies to help address these storage challenges.
For personalized guidance on optimizing your Graphite setup, you can book a demo with the MetricFire team here: https://www.metricfire.com/demo/.
Data Aggregation and Downsampling
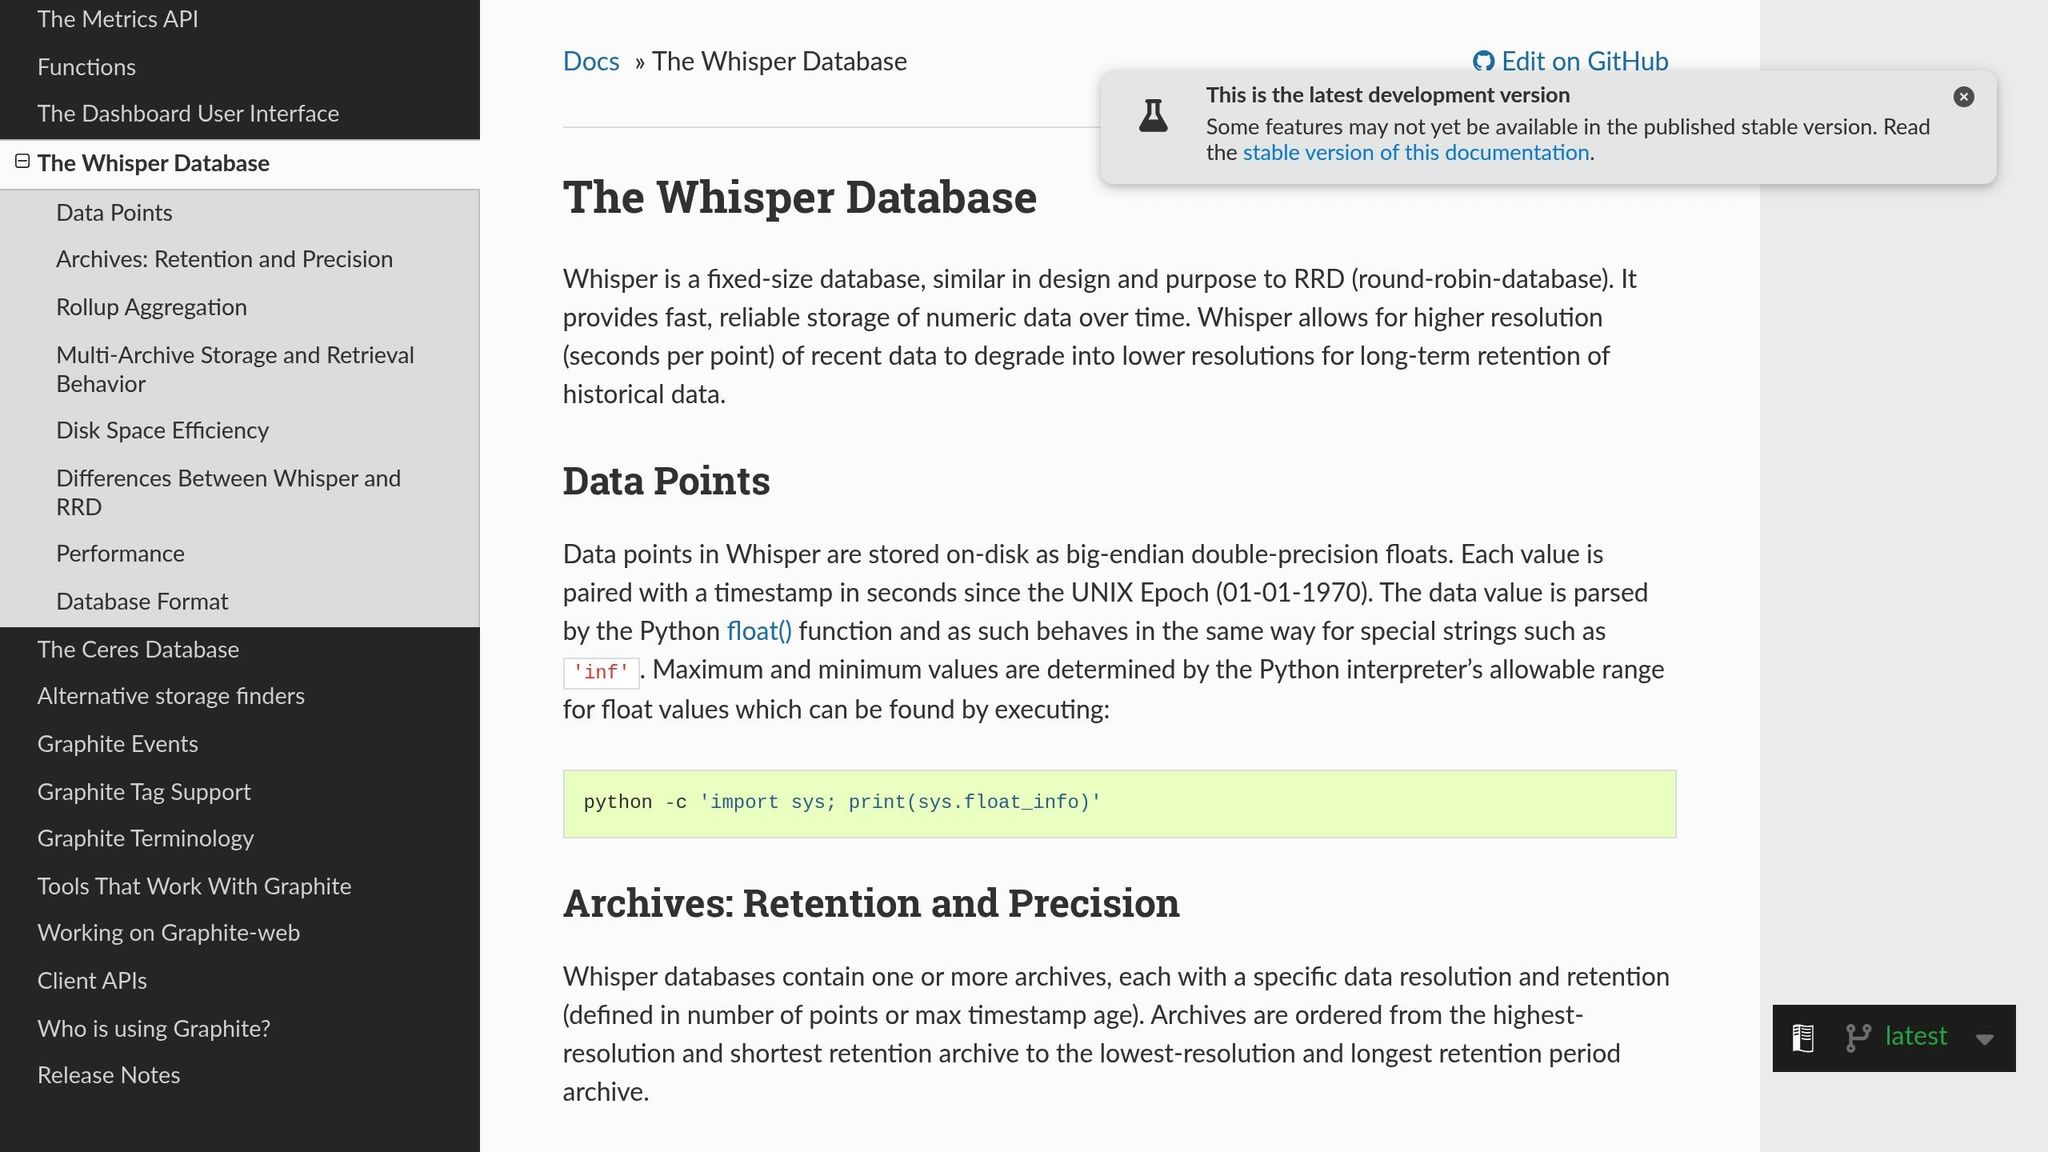
Once you've got a handle on how metrics accumulate, the next step is to manage storage efficiently by rolling up high-resolution data into lower-resolution archives. Whisper makes this possible by supporting multiple archives with different resolutions. This setup lets you keep recent data in fine detail while gradually downsampling older data into broader intervals. The result? You save storage space while still maintaining long-term trends.
"Whisper allows for higher resolution (seconds per point) of recent data to degrade into lower resolutions for long-term retention of historical data." - Graphite monitoring tool tutorial
The trick to efficient storage lies in configuring lower-resolution archives for extended retention. For instance, storing data at a 10-second resolution for 14 days requires 120,960 points. But if you switch to a 1-hour resolution for a 2-year period, you only need 17,520 points. This translates to a massive reduction in disk space and I/O demands. The next step is to align data granularity with your specific needs.
Choosing the Right Data Granularity
Your collection interval should match the finest resolution in your retention schema. For example, if your system collects metrics every 10 seconds, the first retention tier should also be set to 10s. Mismatched intervals can lead to wasted storage or data loss. For longer retention periods, opt for coarser resolutions that strike a balance between detail and storage efficiency - like using a 1-minute resolution for short-term data and a 10-minute or hourly resolution for long-term data.
The aggregation method you choose is just as important and should fit the type of metric you're working with:
- Use
averagefor gauges (e.g., CPU usage or memory load). - Use
sumfor counters (e.g., total requests or sales). - Use
maxorminfor metrics where extremes matter (e.g., latency).
Choosing the wrong method can skew your data, so it’s worth taking the time to get this right.
Another key setting is the xFilesFactor, which determines the minimum fraction of non-null slots required for aggregation. The default is 0.5, meaning 50% of slots must have data. For sparse metrics, you might lower this to 0.1 or even 0 to ensure aggregated points are saved. If every data point matters, set it closer to 1.
Setting Up Whisper Files for Aggregation
Once you've decided on granularities, configure your Whisper files to reflect these retention tiers. In the storage-schemas.conf file, always list retentions in order of precision - from the most detailed (shortest history) to the least detailed (longest history):
[production_metrics]
pattern = ^prod\.
retentions = 10s:6h,60s:1d,10m:7d
This example keeps 10-second data for 6 hours, 1-minute data for 1 day, and 10-minute data for 7 days. The total retention period is equal to the longest archive's duration.
Make sure that each lower-resolution archive divides evenly into the higher-resolution one. For instance, a 60-second archive can follow a 10-second archive (since 60 ÷ 10 = 6), but a 180-second archive can't follow a 600-second archive (as 600 ÷ 180 isn’t a whole number). Misalignments like this can lead to inaccurate aggregation.
In the storage-aggregation.conf file, ensure that the aggregation method matches your metric type:
[sum_counters]
pattern = \.count$
aggregationMethod = sum
xFilesFactor = 0

[max_latency]
pattern = \.latency$
aggregationMethod = max
xFilesFactor = 0.5
Keep in mind that changes to configuration files only apply to new metrics. To update existing .wsp files, use whisper-resize.py for retention schema adjustments and whisper-set-aggregation-method.py for updating aggregation methods.
For high-frequency metrics, consider using carbon-aggregator to buffer and pre-aggregate data before it reaches Whisper. This not only reduces I/O load but also allows for smaller initial file sizes.
These downsampling techniques set the stage for fine-tuning your retention policies, which we’ll explore in the next section.
If you'd like hands-on guidance, book a demo with the MetricFire team to learn how to optimize your Graphite storage.
Tuning Retention Policies
Graphite Storage Optimization: Retention Tiers and Cost Reduction Strategies
Retention policies play a key role in managing storage by determining how long different data resolutions are retained. These policies directly impact storage costs - keeping high-resolution data for extended periods can quickly consume disk space. The goal is to strike a balance between operational needs and storage efficiency: retain high-resolution data for short durations and rely on downsampled data for long-term storage.
Setting Up Tiered Retention
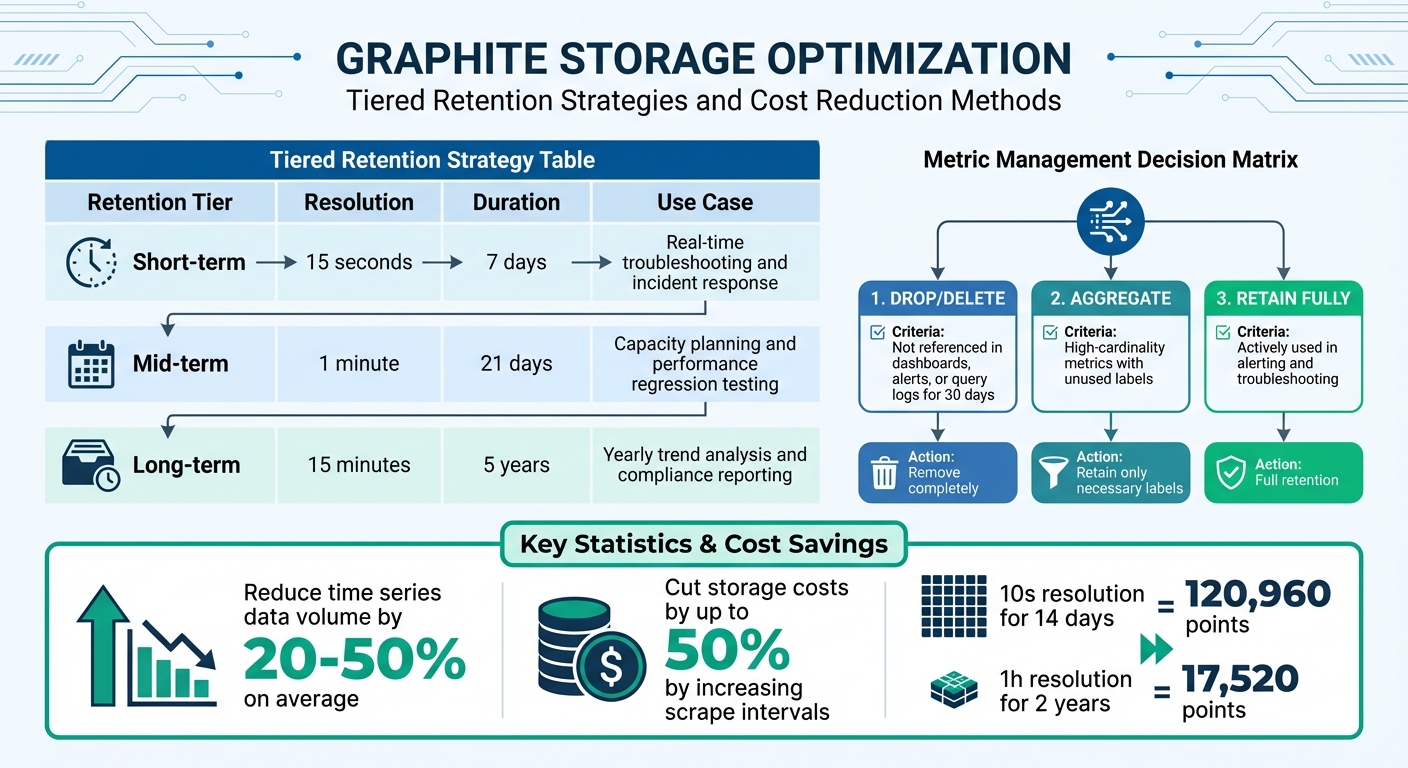
A good retention strategy often involves at least three tiers. Each tier serves a specific purpose:
- Short-term retention: High-resolution data (e.g., 15 seconds per point) for immediate troubleshooting, typically kept for 7 days.
- Mid-term retention: Medium-resolution data (e.g., 1 minute per point) for weekly analysis and performance regression testing, stored for around 21 days.
- Long-term retention: Low-resolution data (e.g., 15 minutes per point) for trend analysis and compliance, retained for up to 5 years.
Here's an example of how these tiers might look:
| Retention Tier | Resolution | Duration | Use Case |
|---|---|---|---|
| Short-term | 15 seconds | 7 days | Real-time troubleshooting and incident response |
| Mid-term | 1 minute | 21 days | Capacity planning and performance regression testing |
| Long-term | 15 minutes | 5 years | Yearly trend analysis and compliance reporting |
When configuring your storage-schemas.conf, always list retentions in order of precision, from the most detailed to the least detailed:
[critical_metrics]
pattern = ^prod\.critical\.
retentions = 15s:7d,1m:21d,15m:5y
"The general rule is to specify retentions from most-precise:least-history to least-precise:most-history – whisper will properly downsample metrics (averaging by default) as thresholds for retention are crossed." - Graphite Documentation
It's important to note that Whisper archives overlap rather than stack. The total retention period is determined by the longest archive's duration, not the combined length of all tiers.
Deciding Which Metrics to Keep
Another crucial aspect of retention policies is deciding which metrics are worth keeping. Retaining every metric can lead to unnecessary costs, so focus on metrics that provide real value. A usage-based approach can help reduce costs by dropping or aggregating low-value metrics. For example:
- Metrics that haven't been referenced in dashboards, alerts, or query logs for 30 days can be dropped entirely.
- High-cardinality metrics (those with lots of unique label combinations) often drive up costs. If only a subset of labels is used, consider aggregating the less useful labels. For instance, instead of storing per-core CPU metrics, you could aggregate them into per-machine or per-datacenter averages for long-term storage.
By systematically identifying and aggregating unused or low-value metrics, organizations can reduce their time series data volume by 20% to 50% on average. Additionally, increasing the scrape interval for less critical metrics (e.g., from 15 seconds to 60 seconds) can cut storage costs by up to 50%.
Here's a quick decision matrix to guide you:
| Metric Category | Action | Criteria |
|---|---|---|
| Drop | Drop/Delete | Not referenced in dashboards, alerts, or query logs for 30 days |
| Aggregate | Aggregate | High-cardinality metrics with unused labels; retain only the necessary labels |
| Retain Fully | Full Retention | Actively used in alerting and troubleshooting |
To further optimize, use tools like carbon-relay-ng with blocklists or regular expressions to filter out redundant metrics before they even reach your storage backend. This proactive approach can help streamline storage while maintaining operational efficiency.
Improving Storage Backend Performance
Once you've optimized retention policies, it's time to focus on the storage backend. By fine-tuning Graphite architecture and concepts like Whisper databases and Carbon daemons, you can make I/O operations more efficient, reduce disk strain, and cut down on operational costs. These adjustments complement earlier retention and aggregation strategies, pushing your system's performance even further.
Tuning Whisper Database Settings
Whisper, a fixed-size database format, reserves disk space for every time-slot in an archive, regardless of whether data is stored there or not. If your archives are poorly configured, this can lead to significant storage waste. To avoid this, ensure that the precision of longer-retention archives divides evenly into higher-resolution ones. For instance, 60-second intervals should align neatly with 300-second intervals. This alignment avoids partial point interpolation issues and ensures accurate data aggregation.
To prevent errors like "Too many open files", increase the default file descriptor limit from 1,024 to at least 8,192. You can adjust this limit using ulimit for individual processes or sysctl for system-wide changes.
If you need to update retention policies without losing data, use the whisper-resize tool. This allows you to reclaim storage or extend history on .wsp files configured with less-than-ideal settings. For scaling beyond a single instance, implement carbon-relay.py with consistent hashing to distribute I/O loads across multiple instances.
| Component | Primary Function | Optimization Benefit |
|---|---|---|
| carbon-cache | RAM buffering and batch flushing | Reduces disk I/O and serves recent data from memory |
| carbon-aggregator | Pre-storage data consolidation | Minimizes Whisper file sizes and write operations |
| carbon-relay | Load distribution via hashing | Balances I/O across multiple backend instances |
| whisper-resize | Retention policy updates | Reclaims space or extends history on existing files |
With these database optimizations in place, caching can further ease the load on your storage system.
Using Caching to Reduce Storage Load
Caching is a powerful way to lighten the load on your storage backend. The carbon-cache.py daemon temporarily stores metric values in RAM and writes them to disk in batches. This reduces the frequency of disk writes and allows the Graphite webapp to serve recent data directly from memory, cutting down on disk reads for the most current metrics.
For even better performance, pair carbon-aggregator.py with carbon-cache.py. The aggregator buffers metrics for a set interval, consolidates them, and then writes them to Whisper. This not only reduces I/O load but also decreases the number of stored metrics.
When using carbon-relay.py with consistent hashing, configure the CARBONLINK_HOSTS setting in the Graphite webapp. This enables the app to query the RAM cache of carbon-cache instances directly. By spreading read operations across several backends, you can further minimize disk access for fresh data. As the Graphite documentation highlights:
"As the number of incoming metrics increases, one carbon-cache.py instance may not be enough to handle the I/O load. To scale out, simply run multiple carbon-cache.py instances... behind a carbon-aggregator.py or carbon-relay.py."
For organizations managing large-scale Graphite setups, maintaining and optimizing storage backends can be resource-intensive. Opting for managed Graphite services can slash infrastructure and maintenance costs by up to 75% compared to self-hosted solutions. Jim Davies, Head of DevOps at MoneySuperMarket.com, shares this perspective:
"Building and managing an on-premise installation at this scale would require a lot of engineer time...we use this engineering time to work on initiatives closer to our core business."
If you're looking to simplify your monitoring setup, book a demo (https://www.metricfire.com/demo/) and connect with the MetricFire team to explore tailored solutions for your needs.
Filtering Metrics Before Storage
When it comes to cutting Graphite storage costs, filtering metrics before they even reach storage is a smart follow-up to aggregation and retention tuning. By dropping non-essential metrics upstream, you can sidestep unnecessary storage expenses and keep your system lean.
To put this into perspective, a basic monitoring setup can churn out around 50,000 active series in an unloaded 3-node cluster. A significant chunk of these metrics won’t offer much long-term value. Filtering them out before storage can drastically reduce both your metric count and associated costs. Let’s explore the tools you can use to make this process efficient.
Tools for Filtering and Routing Metrics
The go-to tool for filtering and routing metrics in Graphite is Carbon-relay-ng. Positioned between your metric sources and storage backends, it allows you to drop, aggregate, or route metrics based on patterns like regular expressions, prefixes, or substrings.
Here’s how it works:
- Blocklisting: Apply regular expressions to incoming metrics. Any metric matching the expression is dropped globally before it even reaches a route.
- Route-Specific Filtering: Configure filters for each destination, ensuring only the necessary metrics are forwarded.
- Aggregation: Combine multiple metrics into one (e.g., average, sum, count) and discard the raw data when
dropRawis set to true. - Validation Filtering: Eliminate data containing problematic characters for Graphite.
When setting up aggregators, use the prefix parameter. While it doesn’t filter metrics, it skips regex checks for non-matching data, speeding up processing. Additionally, use the wait parameter to account for potential data delays, ensuring all points are included before aggregation is flushed.
| Strategy | Tool | Description |
|---|---|---|
| Blocklisting | carbon-relay-ng |
Uses regex to globally drop matching metrics before they reach any route |
| Route Filtering | carbon-relay-ng |
Filters metrics for specific destinations using substrings, prefixes, or regex |
| Aggregation | carbon-relay-ng |
Combines metrics (e.g., avg, sum) and discards raw data |
| Validation Filtering | carbon-relay-ng |
Drops data with characters known to cause issues in Graphite |
Finding and Removing Redundant Data
Filtering configurations are just one piece of the puzzle. Identifying and eliminating redundant data is another key step in optimizing storage. Start by analyzing your metrics to find sources driving storage volume. A simple shell command like this can help you spot high-volume prefixes:
cut -f1,2 -d. metrics-index.txt | sort | uniq -c | sort -n
You can also use tools like the walk_metrics.py script to navigate your metric hierarchy and identify redundant sub-trees to exclude. Alternatively, query the /metrics/find endpoint to locate low-value nodes before they’re stored.
Two common strategies for filtering redundant data are allowlisting and denylisting:
- Allowlisting: Define a core set of critical metrics (e.g., those used in key dashboards or alerts) and drop everything else.
- Denylisting: Target specific high-cardinality or redundant metrics while retaining the rest.
Allowlisting provides tight control over costs, while denylisting is better for more selective optimization.
Another effective tactic is deduplication. For example, removing duplicate metrics from high-availability pairs can trim your active series count by 50%. Aggregating metrics by excluding specific nodes, like server names, can further reduce your total metric count by 25% or more in typical setups. Before implementing filters, tools like sed and wc -l can help you estimate the potential reduction in your metric count by analyzing a text file of your metrics.
Tracking Storage Usage and Costs
After implementing filtering and aggregation strategies, it's essential to ensure your optimizations are delivering results. By keeping an eye on storage usage, you can validate cost-saving measures and spot any unexpected trends. Regularly reviewing storage metrics not only helps you identify cost drivers early but also lets you measure the effectiveness of your adjustments. This step ensures that your efforts translate into noticeable reductions in storage costs.
Monitoring Storage Growth and Setting Alerts
One critical metric to monitor is your active time series count, as it has a direct impact on storage costs. For hosted environments, tools like the "Grafana Cloud Billing/Usage" dashboard provide real-time insights into this data. Tracking your time series count over time helps you confirm whether your optimizations are holding steady or if new metrics are driving up usage.
To dig deeper into what’s driving growth, analyze your metrics' prefixes. For example, you can use the cut command to examine prefix distribution, highlighting which top-level prefixes - like statsd timers or infrastructure metrics - dominate your series. For more comprehensive analysis, the walk_metrics.py script can scan your entire metric hierarchy, though note that this process may take over an hour in very large environments. If you're working with tagged metrics, functions like countSeries(seriesByTag('tag=value')) can help identify high-cardinality tag combinations. Additionally, configuring carbon-relay-ng to emit proxy metrics (e.g., aggregate_count.servers.dc1) offers further insight into data point volumes.
Measuring Optimization Results
Tracking growth is one thing, but measuring the actual impact of your changes is just as important. After making adjustments, compare your metrics before and after to evaluate savings. The timeShift() function is particularly useful for this - using something like timeShift(series, "1w") lets you overlay last week's data with the current week’s data to visualize reductions over time. Before finalizing any changes, simulate their potential effect by using tools like sed and wc -l on your metrics index file. This can help estimate how many series a specific aggregation rule might remove.
In addition to monitoring active series, keeping an eye on data points per minute (DPM) is equally important, as both metrics directly influence storage costs. If you’ve implemented aggregation using carbon-relay-ng, compare the volume of data points entering the aggregator to those being flushed out. This comparison can give you a clear picture of how much data you’ve reduced. For environments with multiple teams or applications, grouping usage by source is an effective way to attribute costs and identify which areas are driving growth.
If you're looking for tailored advice, consider booking a MetricFire demo to explore how you can better manage and optimize your Graphite storage costs: https://www.metricfire.com/demo/.
Conclusion
Improving Graphite storage efficiency leads to a smoother, more reliable monitoring system. One effective approach is data aggregation. For example, consolidating per-core metrics into per-machine metrics can reduce your total metric count by about 25%.
In addition to aggregation, refining retention policies and filtering metrics can further optimize your setup. By combining these practices - aggregation, tailored retention policies, and proactive filtering - you can minimize storage demands and enhance query performance. Tools like carbon-relay-ng are especially helpful, as they block unnecessary or duplicate metrics from being stored in the first place. On the backend, techniques like caching and Whisper tuning ensure your system remains stable and responsive, even as your monitoring requirements expand.
These strategies not only improve operational efficiency but also yield cost savings. As MetricFire puts it, "Hosted Graphite eliminates common challenges of self-hosted Graphite monitoring, like aggregation, scaling, long-term storage, and query timeouts". Implementing a well-rounded plan using these methods can reduce expenses while preparing your monitoring infrastructure for future growth.
To maintain these benefits, it’s essential to keep an eye on your system. Regularly track storage usage and evaluate the impact of your optimizations. Tools like the timeShift() function, paired with other monitoring techniques, can help confirm that your adjustments are delivering the desired results, ensuring your system remains efficient as your infrastructure evolves.
Ready to get started? Sign up for a free trial (https://www.hostedgraphite.com/accounts/signup/) to explore the benefits of Hosted Graphite, or schedule a demo (https://www.metricfire.com/demo/) to discuss your monitoring needs directly with the MetricFire team.
FAQs
How do I find my highest-cardinality metrics?
High-cardinality metrics are those with a large number of unique label combinations. These can significantly affect both storage and query performance. To pinpoint these metrics, focus on those with the most diverse labels.
Graphite offers tools like data views and functions to help analyze label diversity effectively. By using these features, you can identify areas where optimization is needed.
It's also important to regularly review your metrics. Applying aggregation rules and managing data views can help you keep high-cardinality metrics under control. This not only reduces storage costs but also ensures smoother performance overall.
How can I change retention without losing data?
To update retention settings in Graphite without risking data loss, you need to modify the storage-schemas.conf file. Adjust existing retention rules or add new ones as needed, then save the file. Afterward, restart the carbon-cache.py daemon to apply the changes. The existing data will remain unaffected, while the updated retention rules will take effect for any new metrics that match the specified patterns. This approach ensures your current data stays safe while incorporating the new settings.
What should I filter before Whisper writes it?
Before writing data with Whisper, it's important to filter metrics to include only those that are relevant to your analysis. Since Whisper operates as a fixed-size database, it retains data according to pre-set retention policies. To save space and boost performance, avoid storing metrics that aren't necessary.
If your retention needs change, you can adjust Whisper files using tools like whisper-resize. This allows you to align storage with your specific timeframes, ensuring you only keep the data you need. By doing this, you can cut down on storage costs and make your system more efficient.