
Table of Contents
- Real-Time Data Visualization with Grafana
- Building Real-Time Dashboards with Grafana | Time-Series Database Essentials
- Prerequisites for Setting Up Grafana
- Installing and Configuring Grafana
- Connecting Grafana to MetricFire Hosted Graphite
- Building Real-Time Dashboards in Grafana
- Optimizing Grafana Performance for Real-Time Data
- Advanced Configuration and Troubleshooting
- Conclusion
- FAQs
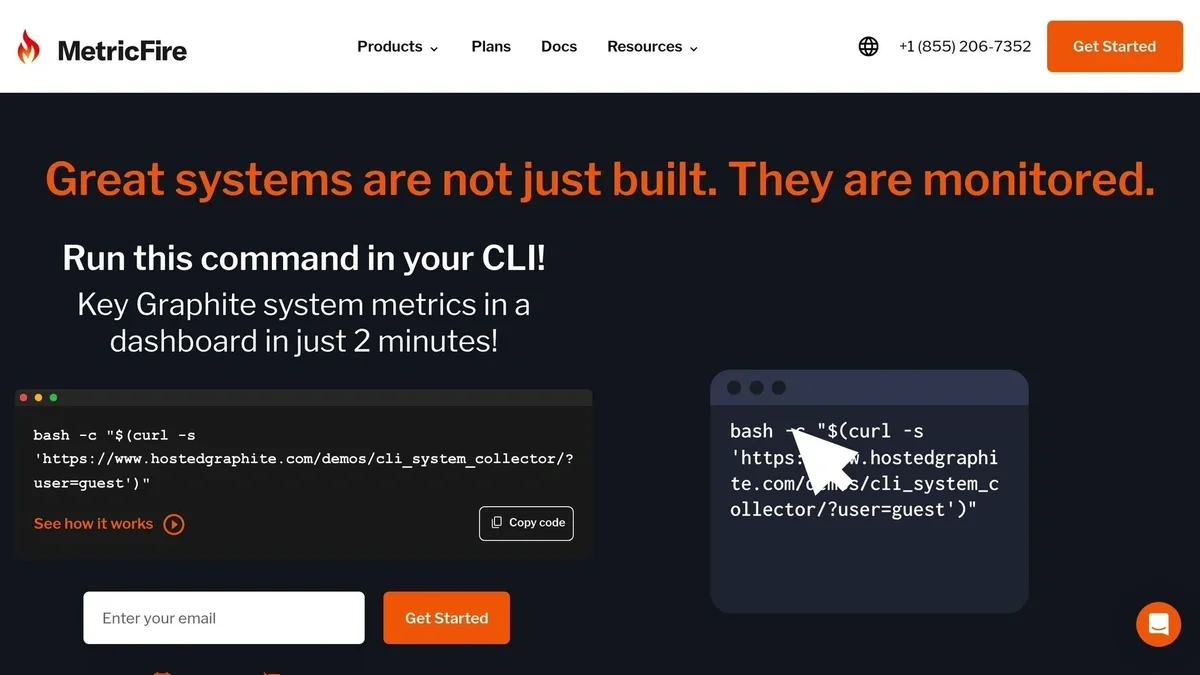
Great systems are not just built. They are monitored.
MetricFire runs Graphite and Grafana as a fully managed service for small engineering teams, taking care of storage, scaling, and version updates so your team doesn't have to. Plans start at $19/month, billed per metric namespace rather than per host, and include engineer-staffed support. Integrations work natively with Heroku, AWS, Azure, and GCP, and data is stored with 3× redundancy in SOC2- and ISO:27001-certified data centres.
Real-Time Data Visualization with Grafana
Real-time data visualization is an essential tool for managing modern IT systems. Grafana, a widely-used open-source platform, enables you to monitor and visualize metrics from over 150 data sources like Prometheus, InfluxDB, and SQL databases. With features like Grafana Live for real-time updates and integrated alerting, it ensures quick responses to system issues. MetricFire's Hosted Graphite simplifies the setup process, offering scalable plans starting at $19/month, with a 14-day free trial available. This guide covers everything you need to know - from getting started with Grafana to creating dynamic dashboards for real-time insights.
Building Real-Time Dashboards with Grafana | Time-Series Database Essentials
Prerequisites for Setting Up Grafana
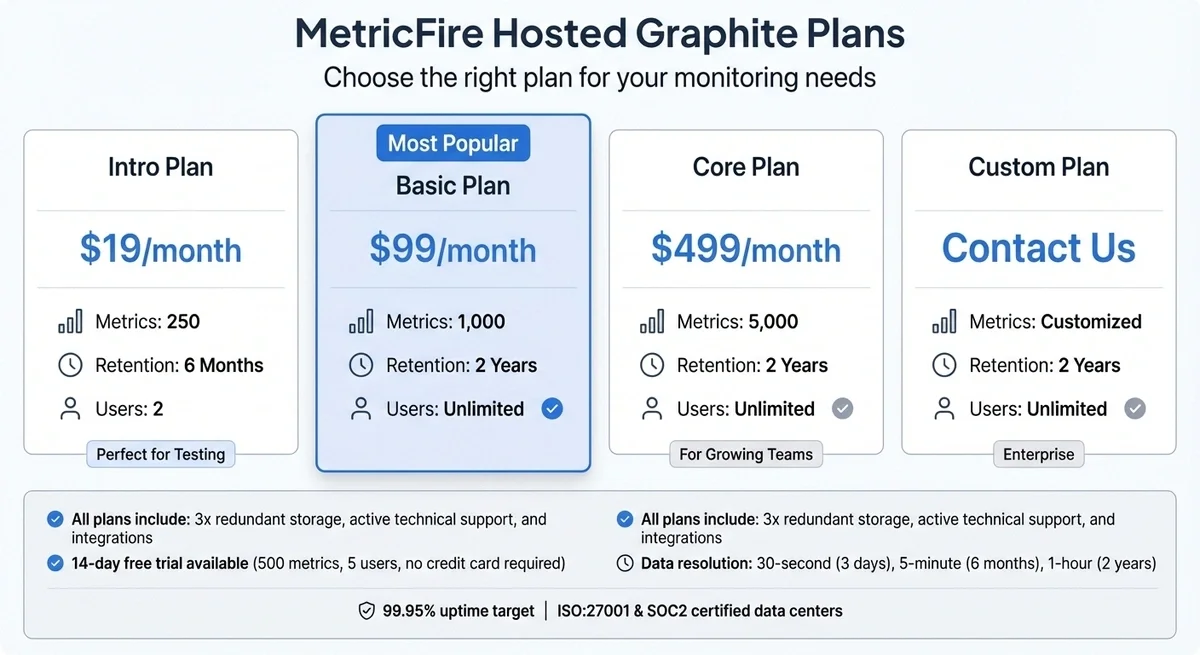
MetricFire Hosted Graphite Pricing Plans Comparison
System Requirements and Installation Preparation
Grafana is a lightweight tool that requires only 512 MB of RAM and 1 CPU core to operate effectively. This makes it versatile enough to run on almost any modern machine, whether it's an old laptop or a cloud-based virtual machine.
Grafana supports a variety of operating systems, including Windows, macOS, and Linux distributions like Debian, Ubuntu, RHEL, Fedora, SUSE, and openSUSE. To access Grafana, you'll need a supported browser such as the latest version of Chrome, Firefox, Safari, or Microsoft Edge, with JavaScript enabled. By default, Grafana uses port 3000, but it can be configured to run on port 80 if you have the necessary permissions or set up a reverse proxy like Nginx.
For data storage, Grafana relies on SQLite 3 by default. However, for production environments or high-availability setups, it’s recommended to use MySQL 8.0+ or PostgreSQL 12+. If you plan to utilize features like server-side image rendering or intensive alerting, be sure to allocate additional CPU and memory resources.
If you're integrating Grafana with MetricFire's Hosted Graphite, you'll need an account to connect real-time metrics. This setup enables metric data to appear on your Grafana dashboards within approximately 60 seconds of ingestion. Once you've confirmed your system requirements, you can proceed to configure your hosted monitoring with MetricFire.
Choosing a MetricFire Plan
To enable real-time updates in Grafana, you’ll need a reliable hosted solution. MetricFire offers several plans tailored to the number of unique metrics you want to monitor. Metrics are defined as unique time-series namespaces, so you’re not charged separately for host, custom, or tagged metrics. Every plan includes 3x redundant storage, active technical support, and integrations.
| Plan | Monthly Price | Metrics Included | Retention | Users |
|---|---|---|---|---|
| Intro | $19 | 250 | 6 Months | 2 |
| Basic | $99 | 1,000 | 2 Years | Unlimited |
| Core | $499 | 5,000 | 2 Years | Unlimited |
| Custom | Contact Us | Customized | 2 Years | Unlimited |
The Intro Plan at $19 per month is ideal for small projects or testing, supporting up to 250 metrics. It’s a great starting point for validating your setup and creating initial dashboards. MetricFire also provides a 14-day free trial - no credit card required - which supports up to 500 metrics and 5 users. This trial is an excellent way to explore real-time visualization without any upfront commitment. As your needs grow, you can upgrade to the Basic or Core plans, which offer higher metric limits and unlimited user access.
"Hosted Graphite takes away the burden of self-hosting your own monitoring solution, allowing you more time and freedom to work on your most important tasks." - MetricFire
MetricFire stores data at 30-second resolution for 3 days, 5-minute resolution for 6 months, and 1-hour resolution for 2 years. If you need even higher resolution, 5-second data storage is available upon request. The platform operates with a 99.95% uptime target and stores all data in ISO:27001 and SOC2 certified data centers in Frankfurt, Germany. To ensure you never lose track of your metrics, MetricFire automatically creates dashboards and alerts that notify you when you’re approaching your metric limits, preventing data loss.
Ready to get started? Sign up for a free trial at MetricFire's website or book a demo at MetricFire's demo page to discuss your monitoring needs directly with their team.
Installing and Configuring Grafana
Now that you’ve got your system requirements and MetricFire plan sorted, it’s time to dive into installing and setting up Grafana.
Installing Grafana on Windows, macOS, and Linux
Grafana provides different installation methods tailored to your operating system.
For Windows, you can choose between a .msi installer or a .zip binary. If you go with the .zip file, make sure to right-click it, open Properties, and check 'Unblock' before extracting. This step helps avoid potential execution problems.
On macOS, the easiest way is through Homebrew. Just run:
brew install grafana
Then, start Grafana as a background service with:
brew services start grafana
Alternatively, you can download the standalone binary. After extracting it, navigate to the bin directory and run:
./bin/grafana server
For Linux, installation steps depend on your distribution. On Ubuntu or Debian, download the .deb package and install it using:
sudo dpkg -i grafana-enterprise_[version]_amd64.deb
Then start the Grafana service:
sudo systemctl start grafana-server
For RHEL or Fedora, use:
sudo yum install -y [rpm_url]
Follow this with the same systemctl command to start the service. Once installed, open your browser and go to http://localhost:3000. Use the default credentials (admin/admin) to log in, and you’ll be prompted to set a new password.
| Operating System | Installation Method | Startup Command |
|---|---|---|
| Windows | Run .msi installer |
bin/grafana-server.exe |
| macOS | brew install grafana |
brew services start grafana |
| Ubuntu/Debian | .deb package with dpkg |
sudo systemctl start grafana-server |
| RHEL/Fedora | .rpm package with yum |
sudo systemctl start grafana-server |
Once Grafana is running, you’re ready to configure it for real-time data updates.
Configuring Real-Time Data Refresh Settings
By default, Grafana enforces a minimum dashboard refresh interval of 5 seconds to avoid overloading your server or Grafana data sources. However, for real-time monitoring, you may need more frequent updates. To enable refresh rates like 1 second or even 200 milliseconds, you’ll need to tweak the min_refresh_interval setting in Grafana’s configuration file.
-
On Linux, the file is located at
/etc/grafana/grafana.ini. -
For macOS (via Homebrew), it’s usually at
/usr/local/etc/grafana/grafana.inior/opt/homebrew/etc/grafana/grafana.ini. -
Windows users should create a
custom.inifile in the<WORKING_DIRECTORY>/conf/directory.
Open the file, find the [dashboards] section, and uncomment the min_refresh_interval line. Set it to your preferred value, such as:
min_refresh_interval = 1s
Restart Grafana to apply the changes.
Once the server configuration is updated, you can customize refresh options for each dashboard. Go to Dashboard Settings > General > Time Options and add your desired intervals (comma-separated) in the "Auto refresh" field. These intervals will then appear in the refresh dropdown menu on your dashboard.
By default, Grafana Live is enabled, allowing real-time data streaming via WebSockets. This reduces the need for constant polling. Keep in mind, though, that it supports up to 100 simultaneous WebSocket connections, with each connection using around 50 KB of memory.
If you’re running Grafana in Docker, you can override the minimum refresh interval using the environment variable:
GF_DASHBOARDS_MIN_REFRESH_INTERVAL=200ms
.
For optimal performance, stick to the slowest refresh interval that still meets your needs. Faster intervals can strain both your dashboards and your database.
Connecting Grafana to MetricFire Hosted Graphite
With Grafana configured for real-time updates, the next step is to link it to MetricFire's Hosted Graphite. This connection is key to unlocking Grafana's visualization capabilities.
Adding MetricFire as a Data Source
Start by navigating to Configuration > Data Sources in Grafana's sidebar. Click "Add data source" and select Graphite from the list.
You'll need to configure the following settings:
- Name: Choose a clear identifier, like "Hosted Graphite" or "MetricFire Production."
- URL: Enter the HTTP endpoint provided by MetricFire. Be sure to include the protocol, IP address, and port for your Hosted Graphite instance.
- Access: Set this to "Server" (default) so Grafana's backend can directly communicate with the URL.
- Basic Auth: Enable this option and input your MetricFire credentials (username and API key).
- Graphite Version: Select 1.1.x to ensure compatibility with modern Graphite features.
- Backend Type: If you're using MetricFire's infrastructure, set this to Metrictank to unlock additional metadata features.
Here’s a quick reference table for the key settings:
| Setting | Recommended Value | Purpose |
|---|---|---|
| URL | MetricFire Endpoint URL | Points to your Hosted Graphite instance |
| Access | Server (Default) | Ensures Grafana's backend can reach the data source |
| Basic Auth | Enabled | Secures the connection using your MetricFire credentials |
| Version | 1.1.x | Supports advanced Graphite functions |
| TLS Verify | Enabled | Validates server certificates for secure communication |
Once you've entered these details, click "Save & Test". If everything is set up correctly, you'll see a success message confirming the connection.
Data Source Setup Best Practices
To maintain a secure and reliable connection, always keep TLS Verify enabled. This ensures secure communication between Grafana and MetricFire.
If you're using Private Data Source Connect (PDC), set the maximum connection lifetime to under 5 minutes. This minimizes disruptions caused by system lifecycle events, keeping your data flowing without interruptions.
Additionally, Grafana can monitor itself by sending internal performance metrics - like active alerts and status codes - back to Hosted Graphite, exploring various system monitoring options to optimize your setup. This creates a streamlined monitoring system for your entire setup.
For further guidance or to discuss your specific monitoring needs, you can book a demo with the MetricFire team at MetricFire Demo.
Building Real-Time Dashboards in Grafana
With MetricFire integrated, you’re ready to create dashboards that bring your metrics to life as they happen. Grafana transforms raw data into meaningful visuals with customizable panels and dynamic queries.
Creating Dashboards and Adding Panels
To start a new dashboard, head to Dashboards in the main menu, select New, and then click New Dashboard. Once your blank dashboard is ready, hit '+ Add visualization' and choose MetricFire as your data source. Keep in mind that every panel requires at least one query to display data.
Set a refresh interval that fits your needs - or use Grafana Live with WebSockets for nearly instant updates. This is especially handy when monitoring IoT devices or live events. While Grafana provides "soft real-time" updates, factors like network latency can still cause delays of a few hundred milliseconds.
Select a panel layout that best supports real-time data. Custom layouts let you manually resize and arrange panels, while Auto grid layouts automatically adjust panel sizes. They also support show/hide rules, so you can keep your dashboard focused on active queries and hide panels when no data is returned.
To make your dashboard even more interactive, use query filters and variables for personalized, live updates.
Using Query Filters and Variables for Live Updates
Ronald McCollam from Grafana Labs explains:
"Variables make your Grafana dashboards dynamic instead of static. They allow you to filter and search for the data you care about most, without having to edit queries or rebuild dashboards."
For example, the built-in __timeFilter variable automatically adjusts your queries to match the selected time range on your dashboard. If you switch from viewing the last hour to the last 24 hours, this variable ensures your queries fetch the correct data. In SQL or InfluxDB queries, simply include WHERE $__timeFilter to align with the dashboard's time range.
Query variables can also retrieve values such as server names or service IDs directly from your data source. This creates dropdown menus that update all panels when you make a selection. You can even chain variables - for instance, selecting a region filters the available clusters, which then filters the instances. For time-sensitive variables, set the Refresh option to "On time range change" to keep your filters up to date with your dashboard’s refresh settings.
Interval variables help organise data over time. By using $__interval in your queries, such as summarize($__interval, sum), Grafana calculates the best grouping interval based on your time range and graph resolution. This ensures your visualizations stay clear, whether you're analyzing the last 15 minutes or the past 30 days.
Ready to start monitoring your infrastructure? Sign up for a free trial at MetricFire or book a demo at MetricFire Demo.
Optimizing Grafana Performance for Real-Time Data
Once you've set up dashboards and configured data sources, the next step is ensuring your Grafana instance runs smoothly. Optimizing performance is crucial to maintain reliable, real-time monitoring, especially during periods of heavy usage.
Configuring Panel Refresh Rates and Alerts
The refresh rate in Grafana controls how often it retrieves updated data from MetricFire. You can adjust this setting using the refresh drop-down menu in your dashboard toolbar, with options like 1m, 5m, and 15m. According to Grafana's documentation:
"Choose the slowest refresh interval that meets your requirements. Selecting a faster interval when data changes infrequently can degrade dashboard performance."
For metrics that update periodically, like business performance indicators, a 5-minute refresh rate strikes a good balance between visibility and server load. On the other hand, for critical systems - such as monitoring API response times or payment processing queues - a 1-minute interval is more appropriate.
To manage alerts effectively, consider setting up multi-dimensional alerts, which group related resources. This approach reduces the risk of generating high-cardinality result sets, where thousands of unique alert combinations can overwhelm your database. To avoid "flapping" alerts - alerts that repeatedly fire and resolve - set a pending period to ensure issues persist before triggering notifications. Additionally, stabilize your queries by using time-windowed aggregations like avg_over_time, which smooth out data fluctuations.
Using Grafana Live for Streaming Data
Grafana Live introduces a push-based data model using WebSockets, replacing traditional polling. Instead of your dashboard continuously checking for updates, MetricFire pushes new data directly to your browser as it becomes available. This is especially useful for IoT applications, live event monitoring, or any scenario with rapidly changing metrics.
The system relies on a Pub/Sub architecture, where the frontend subscribes to specific channels. All subscriptions are multiplexed into a single WebSocket connection. While Grafana Live provides real-time updates, it's worth noting:
"By 'real-time', we indicate a soft real-time. Due to network latencies, garbage collection cycles, and so on, the delay of a delivered message can be up to several hundred milliseconds or higher."
For production environments with multiple Grafana instances, you can enhance reliability by configuring a Redis-based high-availability (HA) engine to synchronize messages across instances. Additionally, use Nginx to handle WebSocket upgrades for stable connections. Don't forget to increase your operating system's open file limit (ulimit -n), as each WebSocket connection requires its own file descriptor.
If you're curious about how MetricFire’s hosted platform can elevate your real-time monitoring experience, schedule a demo with the team.
Advanced Configuration and Troubleshooting
Integrating Kubernetes and Cloud Monitoring Metrics
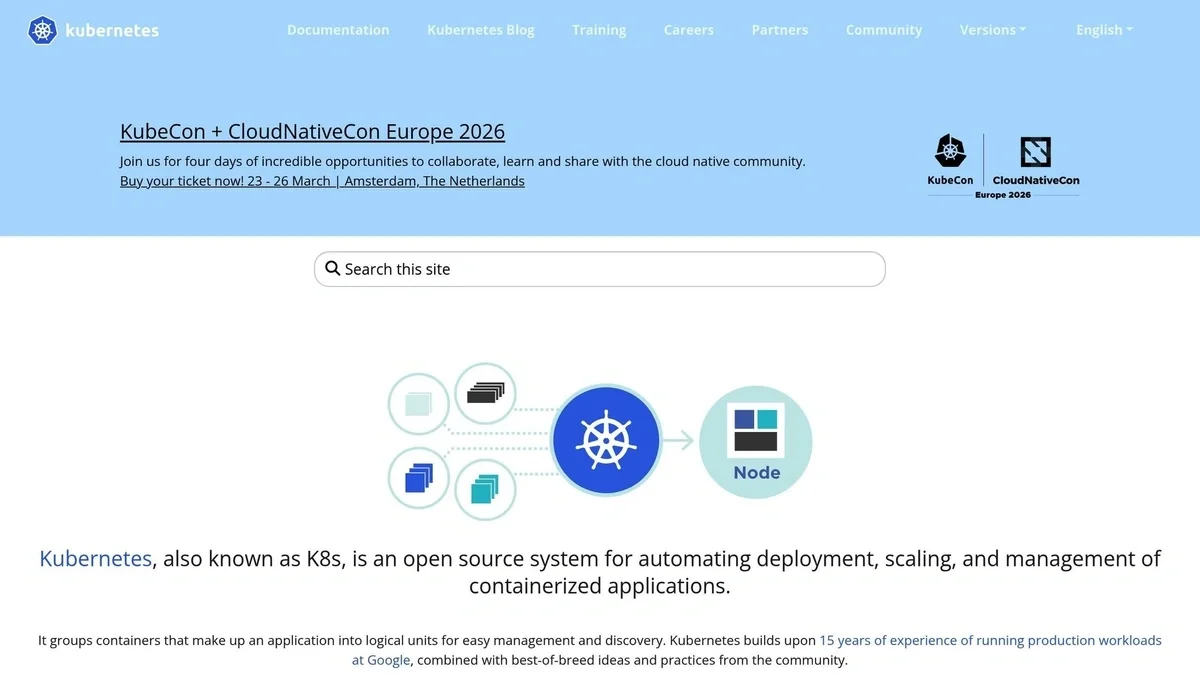
To monitor your Kubernetes environment, integrate its metrics into Grafana via MetricFire. This setup allows you to monitor container performance, resource usage, and overall cluster health. Start by configuring your Kubernetes environment to send metrics to MetricFire's hosted Graphite endpoint. Deploy a metrics collection agent, such as Telegraf or StatsD, within your cluster. These agents will gather data from the Kubernetes API and forward it to your MetricFire account.
Next, add your Hosted Graphite instance as a data source in Grafana. Use the connection details provided by MetricFire, and prioritize tracking key metrics like pod CPU and memory usage, node availability, and deployment rollout status. For a more comprehensive view, configure your cloud monitoring service to export metrics to MetricFire. This lets you visualize Kubernetes data alongside other cloud metrics, offering a unified perspective on your infrastructure.
Once everything is set up, you’ll have the insights needed to resolve performance bottlenecks and scale your setup efficiently.
Solving Common Issues and Scaling Your Setup
Slow dashboard rendering is a common issue, especially when Grafana processes too many time series or queries across extended time ranges. To address this, use Graphite functions like highestMax to limit the number of series returned. Additionally, apply the alias function to simplify long metric names, which can help optimize MetricFire's backend performance.
Suboptimal refresh rates can occur when dashboards refresh more frequently than the underlying data updates. This mismatch can strain resources unnecessarily. For dashboards covering longer time ranges, you may want to disable auto-refresh entirely to reduce server load.
Data gaps can lead to misleading visualizations in Grafana, as it often connects points by default, even when data is missing. To avoid this, use the "No value" option or switch to a "Points" visualization. This way, only existing data is displayed, providing a more accurate representation of your metrics.
Conclusion
Setting up real-time data visualization with Grafana becomes much simpler when combined with MetricFire's hosted monitoring platform. This guide has walked you through the key steps - installing Grafana, connecting it to MetricFire's Hosted Graphite, creating dynamic dashboards, and fine-tuning performance for live data streams. Every configuration choice, from refresh intervals to query parameters, affects how effectively you can identify and address infrastructure issues. These steps work together to provide a smooth, real-time view of your systems, enabling faster and more informed decisions.
By following this integrated approach, operations monitoring becomes far more efficient. The partnership between Grafana and MetricFire removes the hassle of managing a self-hosted monitoring stack. MetricFire not only shortens setup time but also offers professional support, allowing your team to focus on analyzing metrics instead of maintaining complex infrastructure.
With Grafana Live and MetricFire working together, you’ll get real-time alerts for performance issues. Whether you're monitoring gateway latency, Kubernetes pod restarts, or even financial cost metrics, this unified view of your infrastructure delivers the insights you need to act quickly. Plus, the flexibility to scale from 250 metrics on the Intro Plan at $19/month to custom enterprise solutions ensures that your monitoring setup can grow alongside your needs. Higher-tier plans even include unlimited users and alerts, making it a scalable solution for teams of any size.
Ready to get started? Sign up for a free trial and begin monitoring your infrastructure today. If you'd like to explore your options further, book a demo and connect with the MetricFire team to discuss your specific monitoring requirements.
FAQs
When should I use Grafana Live instead of auto-refresh?
Grafana Live is perfect when you need instant, real-time updates on your dashboards. It streams data directly to your dashboard in real time, so you don't need to rely on manual or scheduled refreshes. This makes it ideal for situations where every second matters - like during incident response or when monitoring critical operations.
On the other hand, auto-refresh updates your dashboards at set intervals. While useful in many cases, it doesn't match the efficiency of Grafana Live for scenarios that demand immediate, low-latency updates.
How do I pick the right dashboard refresh interval for my metrics?
When deciding on a refresh interval, consider how quickly you need updates and the purpose of your dashboard. For near real-time data, choose intervals of 5 seconds or less, which are ideal for high-frequency scenarios. On the other hand, for dashboards where updates aren't as urgent, longer intervals - like 30 seconds or 1 minute - can help ease the load on your system. The key is finding the right balance between keeping your data current and maintaining system performance.
What’s the best way to avoid slow dashboards with lots of time series?
To keep your Grafana dashboards running smoothly, focus on fine-tuning your queries and managing data efficiently. Start by selecting only the columns you actually need and applying filters as early as possible to minimize the amount of data being processed. Reducing the data you retrieve is another smart move - downsample your data by aggregating points over larger intervals to lighten the load.
You can also improve performance by limiting the number of panels on your dashboard and narrowing the time range displayed. These adjustments can make interactions faster and ensure a more responsive experience overall.

