
Table of Contents
Introduction to serverless computing
How do we get started on monitoring AWS Lambda? Let me first introduce you to the term serverless computing. It doesn't matter if you have been in the tech industry only a few months, or you started writing code when Pascal was still considered cutting edge, you probably would have heard the term serverless computing thrown around in recent times. But what exactly is serverless computing? Although this term suggests a computing paradigm that involves no computing servers, that is definitely not the case.
Serverless computing, or serverless for short, simply describes a model of computing wherein cloud vendors dynamically provide computing services to developers, who then use these services to deploy their applications without having to bother about the underlying computing architecture.
Traditionally, deploying a piece of software on the internet would typically involve managing some kind of server infrastructure, be it actual physical servers or cloud hosted virtual ones upon which the software is deployed. In either case, these servers would still need to be managed, as well as their operating system and other server hosting processes required for your application to run.
Using cloud providers such as AWS, do virtualize some aspects of this architecture, eliminating most of the physical hardware concerns, but we would still have to take charge of things such as the operating system and other server processes.
However, with a serverless architecture, we can focus solely on the functioning of our applications without having to worry about any of the server nitty-gritty - almost treating the whole process as though the server does not exist, thus the term serverless.
MetricFire integrates with the big providers, such as AWS, as well as many other data sources. Go ahead and avail your free 14 day trial to get started, or contact us for a quick and easy demo and learn from one of our MetricFire engineers!
AWS Lambda and how it works
AWS Lambda is a serverless computing offering provided by Amazon Web Services which lets you do exactly what I described above, run code in a “serverless” environment. You simply package up your application code as a container image or a zip file, upload it to Lambda and it would automatically and precisely allocate adequate computing power to run your code when it is triggered, also automatically scaling to handle surges when they occur.
All this is handled by AWS, leaving the application developer with one job, focusing on their application code. The best part is, you are only charged for the computing resources you use. You only get charged every millisecond your code executes and the number of times your code is triggered, unlike traditional servers where you incur costs on simply provisioning the servers and ensuring they are properly maintained.
MetricFire will help you achieve visualizing your data without any setup hassles. Go ahead and avail your free 14 day trial to get started, or contact us for a quick and easy demo and learn from one of our MetricFire engineers!
Monitoring AWS Lambda and top lambda metrics
As is the case with any other computing service, monitoring applications running on AWS Lambda is essential to keeping these applications healthy while improving their functionality. Gathering information on certain aspects of your Lambda applications gives you a detailed insight into how your app is performing over time, how it scales, and how quickly it is spun up in reaction to a trigger event.
This information could be about the general health and efficiency of your application, memory consumption,. function startup time or concurrency, or more business-centric information aimed at giving you insights into how your application is being used by consumers, such as how often a certain page is visited or a certain button is clicked.
Worthy of note is the fact that, because AWS Lambda manages infrastructure resources for you, you won’t be able to capture typical system metrics such as CPU usage. That said, Lambda does spit out a host of useful metrics out of the box easily accessible from Amazon CloudWatch or available for extraction from Lambda logs, while supporting the addition of custom metrics via application code.
Below is a list of essential metrics to keep track of when using AWS Lambda, separated into subsections for simplicity.
Concurrency metrics
Concurrency refers to the number of individual requests served by a Lambda function at any given time. Lambda functions scale automatically with incoming requests, meaning that when a new service invokes a function, a new instance of that function is created to handle that event.
This cycle continues until there are enough function instances to handle incoming events or all the reserved concurrency in the concurrency pool is used up and the function is throttled. By default, Lambda allows 1000 concurrent executions per region which are shared by all functions in the region.
When a function scales, it uses concurrency from this concurrency pool, or if its own reserved concurrency if you choose to set one up for that function (a function’s reserved concurrency is a portion of the available pool of concurrent executions that you allocate to one or more functions).
The following metrics track concurrency:
- Concurrent executions: This metric tracks the sum of concurrent executions of a function at any point in time. It is especially useful to know which of your functions regularly requires more concurrency, and to reserve its concurrency appropriately to prevent it from getting throttled or starving other functions which use the same pool.
- Unreserved concurrent executions: This metric tracks the amount of available concurrency left in the pool. It gives you a high-level idea of how efficient your application is, judging from the amount of concurrency leftover during periods of heavy workloads. For example, if certain functions almost always use up all their concurrency during a surge, it's an indicator that these functions are either inefficient or their workload needs to be toned down or spread across multiple functions.
- Throttles: This metric measures the number of throttled invocations on a function. When requests come in, Lambda scales your function to handle them, either pulling from the available concurrency pool or a function reserved concurrency When the invocation rates on a function exceed its reserved concurrency or the available concurrency in the pool, that function is throttled and all incoming requests to that function will be rejected. Constant throttling could indicate more requests than your functions have the capacity to handle and hence signal the need for a system redesign.
Performance metrics
In this section, we’ll touch on metrics that track the efficiency of your functions:
- Duration and Billed Duration: The Duration metric tracks the amount of time, in milliseconds, elapsed during a function’s execution while the Billed duration metric is simply the duration metric rounded up to the next 100millisecond (this is because AWS bills Lambda functions in 100 ms blocks). For example, if the execution time on a function is 208ms, its total billed duration would be 300ms. These metrics give you an idea of how fast or how slow your function executes and as such, guides optimization efforts. In the example above, increasing the available memory of your function could help drop your duration to say 198ms, and as such, your billed duration drops to 200ms - a cost-saving of 100ms.
- Memory Size and Max Memory Used: The memory size metric tracks the total amount of memory allocated to a Lambda function, in megabytes while its max memory counterpart tracks the maximum amount of memory used by a function during an invocation. Memory availability and usage have a direct impact on function performance - too little memory and a function might take longer to start or complete execution, too much memory and you end up wasting resources leading to higher costs. Hence monitoring these metrics helps strike a balance between performance and cost optimization.
- Errors: This metric tracks the number of failed function executions due to internal function errors. By internal function errors, I mean problems with function code, for example, syntax errors. This metric would not track errors caused by other external factors from your function, for example, a function invocation error that fails because that function has reached its concurrency limit.
Invocation metrics
Lambda functions lie dormant until they get triggered/invoked by an event. This could either be asynchronously (the function caller passes an event to the Lambda function and then moves on to other things without waiting for lambda to process the event and return a response) or synchronously (the function caller passes an event to the Lambda function and halts until Lambda has finished processing that event and returned a response before it continues).
Lots of different metrics exist to track different scenarios based on the invocation type, but to keep this article simple, I won’t be touching on those. Rather, I’d touch on the one metric which exists no matter how the function is invoked and is the invocation metric you’d likely come across, the invocation count metric, or simply invocations.
- Invocations: This metric tracks the total number of times a function has been invoked. This helps provide quick insight into function performance. For example, if the invocation count drops well below normal, it’s an early indication that something is wrong. Also, if you have functions in multiple regions, the invocations metric gives you an idea of which function is invoked most frequently, which may point to the need for resource allocation or load balancing decisions for optimal performance.
Applications used to monitor AWS lambda
Having discussed important metrics to pay attention to, the next question becomes how do we collect these metrics and make use of them? AWS provides a built-in service, CloudWatch, that provides extensive monitoring capabilities. If you choose to use an external application, AWS provides an API through which you could fetch metric data from Lambda using external applications.
Using CloudWatch
AWS automatically collects metrics for all functions and sends them to CloudWatch. This behavior is built-in, no configuration is needed on your part. The AWS Lambda console allows you to view the metrics from your functions before sending them to CloudWatch.
Think of it as a kind of read-only CloudWatch integration directly inside the lambda console. Here, you can see graph widgets for metrics collected from your functions in real-time, as seen below:
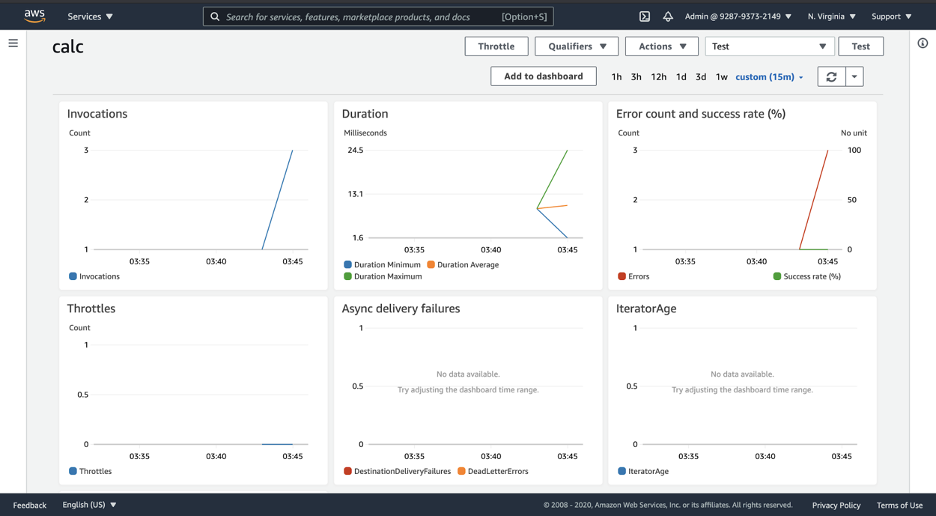
Clicking the Add to dashboard button on the top right of the picture would create a CloudWatch dashboard from these widgets, as such, you can easily build CloudWatch dashboards directly from your Lambda console.
If you wish to add additional Lambda graph widgets to your CloudWatch dashboard, you would need to click the Add Widget button at the top of your CloudWatch dashboard (as seen in the picture below) and then drill down to specific metrics by using dimensions (e.g., the function name, resource, or function version).

AWS Lambda also creates detailed logs about its functioning. These logs are stored in CloudWatch and can be viewed by simply clicking the View logs in CloudWatch button at the top of your Lambda console. While in CloudWatch, you could use CloudWatch Insights to query these logs for data and analyze this data for trends in functional activity.
For example, the query
filter @type = "REPORT"
| stats max(@memorySize / 1024 / 1024) as ReservedMemoryMB,
    avg(@maxMemoryUsed / 1024 / 1024) as AverageMemoryUsedMB,
uses two log fields (@memorySize and @maxMemoryUsed) to fetch memory readings in the logs, and then uses statistical operators (max, avg) to group this data into different columns for better readability. The result of this query would be a table with two columns, ReservedMemoryMB which contains readings for the maximum memory size, and AverageMemoryUsedMB which contains readings for the average memory used.
Also, you could create CloudWatch alarms based on these metrics, for example, an alarm when an error occurs, or when certain functions are throttled.
Key Takeaways
- Monitoring Lambda applications is crucial for maintaining their health and improving performance. Key metrics include concurrency, performance (duration and memory usage), and invocation count. AWS Lambda provides built-in metrics accessible through Amazon CloudWatch.
- Concurrency metrics track the number of concurrent executions of a Lambda function. They help in optimizing resource allocation and avoiding throttling.
- Performance metrics include duration (execution time) and memory usage. These metrics guide optimization efforts to balance performance and cost.
- Invocation metrics, like invocation count, provide insights into how often functions are triggered, helping identify issues or optimization opportunities.
- AWS CloudWatch is the built-in monitoring tool that collects and displays Lambda metrics. It allows for real-time monitoring and dashboards. CloudWatch also stores logs for analysis.
Using an external application such as MetricFire
Using CloudWatch comes in handy if you have your entire architecture running within AWS. However, if you have applications running outside of AWS, or have applications within AWS that rely on external services, then it may be extremely useful to use a monitoring service that allows you to collect data from within AWS, while also monitoring applications running outside of AWS, and providing all this data in one place.
Such an application is MetricFire. Using its Hosted Graphite and Grafana as a Service offering, you can monitor pretty much any application you wish to, and since these are all managed services, you never have to worry about maintenance or performing updates.
MetricFire also provides visibility into AWS, helping you collect metric data on your Lambda functions so you can display this data in a centralized location, alongside data from your other apps not within AWS, how cool is that? This article provides step-by-step instructions on how to monitor your Lambda functions with MetricFire.
However, if you prefer a more hands-on approach, feel free to request a demo today, or take the product for a spin under a free trial.

