
Table of Contents
Great systems are not just built. They are monitored.
MetricFire runs Graphite and Grafana as a fully managed service for small engineering teams, taking care of storage, scaling, and version updates so your team doesn't have to. Plans start at $19/month, billed per metric namespace rather than per host, and include engineer-staffed support. Integrations work natively with Heroku, AWS, Azure, and GCP, and data is stored with 3× redundancy in SOC2- and ISO:27001-certified data centres.
Introduction
Monitoring database availability is not just about whether a database is running. It is about whether applications can connect, execute queries, and receive responses reliably.
Grafana can be used for lightweight availability monitoring by connecting directly to a database and running SQL queries that return status and health information. These queries can be visualized as time series and used to trigger alerts when something goes wrong. This approach works well for simple setups and quick visibility. For larger systems, metrics based monitoring is usually a better fit, but direct SQL queries can still provide a fast and flexible way to check database health.
In this article, we will detail how to connect a DB to an instance of Grafana, and create a simple dashboard and alert for lightweight status monitoring.
Installing and Running Grafana Locally
To get started with Grafana, you can install it locally or run it using Docker. For most users, Docker is the fastest way to get a working instance without dealing with system dependencies.
A simple Docker command can launch Grafana locally on port 3000:
docker run -d -p 3000:3000 --name grafana grafana/grafana
Once the container is running, you can access Grafana in your browser at: http://localhost:3000
The default login is admin for both username and password, and you will be prompted to change it on first login. If you prefer a more complete setup with persistent storage and configuration, you can use Docker Compose. Grafana provides an official example HERE. After Grafana is running, you can begin adding your database as a data source and building availability dashboards.
Alternatively, use MetricFire’s Hosted Grafana to eliminate manual configuration when monitoring your database availability.
Configuring Data Sources in Grafana
Grafana supports connecting directly to databases such as MySQL, PostgreSQL, and SQL Server as data sources. This allows you to run SQL queries and visualize the results without needing an external metrics pipeline.
To set this up, you add a new data source in Grafana and provide connection details such as host, port, database name, and credentials. It is recommended to use a read only user to avoid any unintended changes to production data.
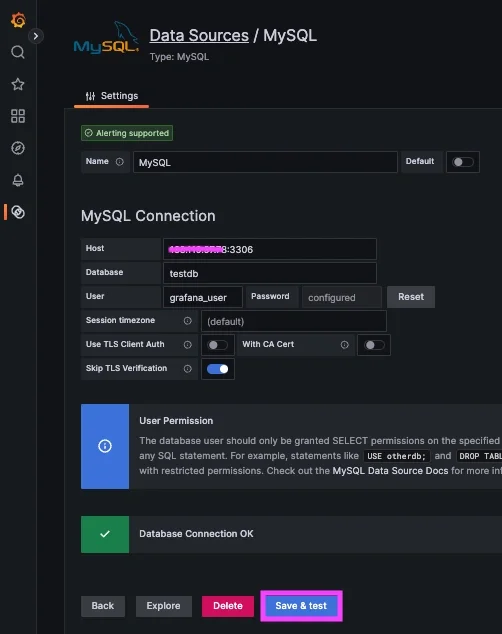
Once connected, you can use Grafana’s query editor to run SQL queries and return time series data that can be plotted on dashboards.
SQL Queries in Grafana for Status Monitoring
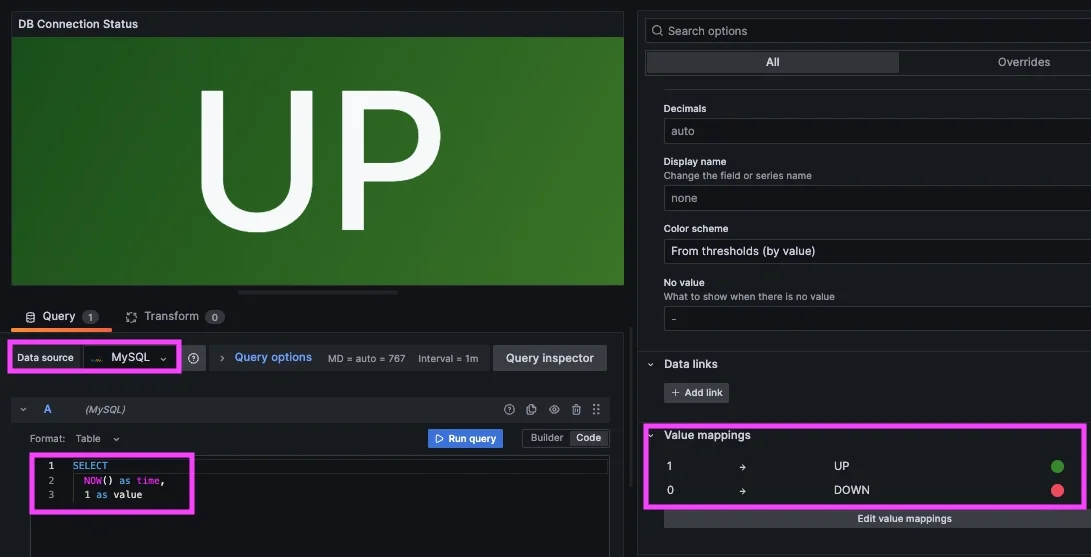
When using a database as a Grafana data source, you are writing SQL queries inside a dashboard panel to return a value that Grafana can display as a graph or status indicator. Each time the panel refreshes, Grafana runs the query and plots the result on the panel.
In this setup, the query typically returns a single value at a specific point in time, rather than a series of historical values. Grafana then builds a time series by repeatedly executing the query at regular intervals and plotting each result over time. This means you are effectively seeing a sequence of snapshots, not a continuous stream of stored data.
A simple example is a connection check query:
SELECT
  NOW() as time,
  1 as value
If this query succeeds, the database is reachable. If it fails, Grafana will not receive data, which can be used to trigger alerts.
You can also query system tables for more detailed signals. For example, tracking active connections:
SELECT
  NOW() as time,
  COUNT(*) as connections
FROM information_schema.processlist
Or monitoring long running queries:
SELECT
  NOW() as time,
  COUNT(*) as long_running_queries
FROM information_schema.processlist
WHERE TIME > 10
These queries return a snapshot of the current state each time they run. Over time, Grafana builds a time series from repeated executions, which is useful for detecting sudden changes such as connection spikes or query backlogs.
However, this approach does not store historical data outside of Grafana’s query results. If you need long term trends or more accurate historical analysis for your DB, a metrics based monitoring system like MetricFire's Hosted Graphite would be a better fit.
Visualizing Database Availability
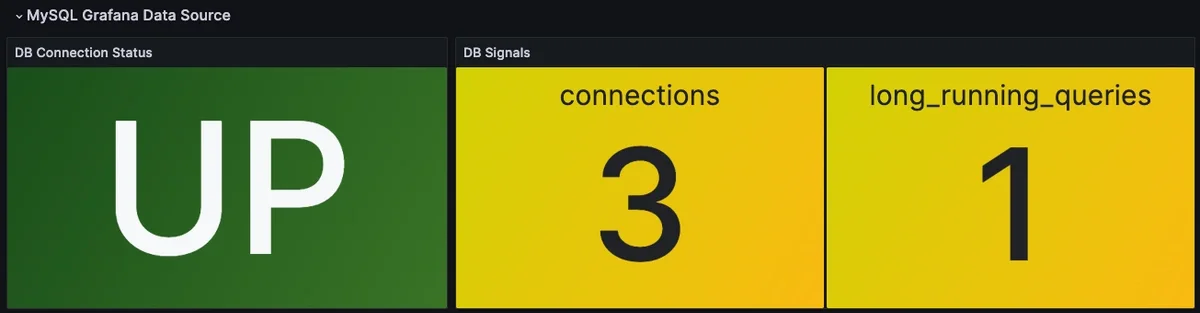
Dashboards for availability should focus on a few clear signals that indicate whether the database is working as expected.
Start with a simple availability panel based on a connection check query. This acts as a heartbeat for the system. Add supporting panels such as connection count and long running queries to provide context when issues occur. It is also helpful to include query latency or basic performance indicators if available, since partial outages often appear as slow responses before a full failure.
The goal is to make it easy to see at a glance whether the database is healthy and, if not, what might be causing the issue.
Alerting on Database Availability
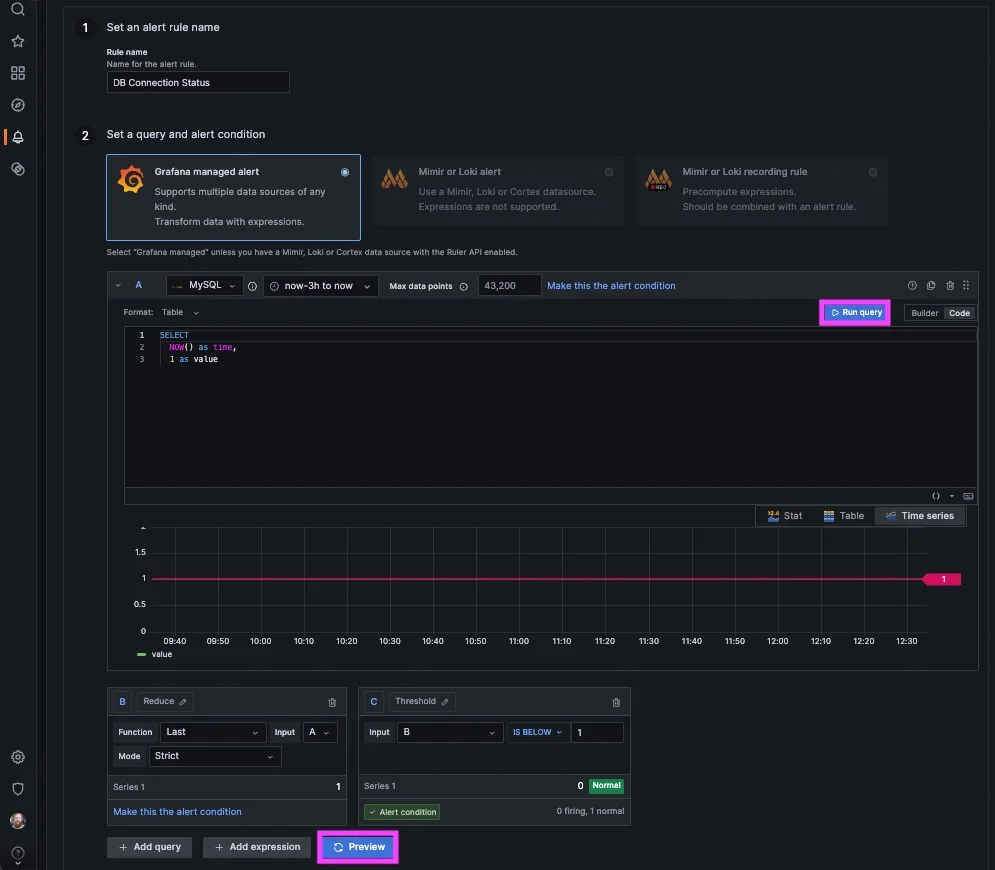
Grafana allows you to create alerts directly from SQL query results, which makes it possible to detect availability issues without setting up a full metrics pipeline. A simple approach is to use a connection check query as a heartbeat. For example, the status query: SELECT NOW() as time, 1 as value returns a constant value as long as the database is reachable. If the query fails or stops returning data, it indicates a potential availability issue.
To create an alert in Grafana, start by building a panel using this query. Then create an alert rule based on that panel. A common condition is: Trigger an alert when the last value is below 1 which works because the query should always return a value of 1 under normal conditions.
It is also important to configure how Grafana handles missing data. Set both “No data” and “Error” states to trigger alerts. This ensures that connection failures or query errors are treated as availability issues. To avoid false positives, add a short evaluation window so the alert only fires if the problem persists for a minute or more. This type of alert provides a simple and effective way to detect when a database becomes unreachable, without requiring a full monitoring stack.
For more robust alerting, metrics-based monitoring allows you to evaluate trends over time, apply aggregations like averages or percentiles, and trigger alerts based on sustained conditions rather than single query results.
When to Use Metrics Instead
Direct SQL queries in Grafana are useful for lightweight availability checks, but they are not designed for continuous, large scale monitoring. Each query runs against the database, which can add overhead if dashboards refresh frequently or if multiple users are querying at once. This makes the approach better suited for simple status reporting rather than full observability.
Metrics based monitoring systems collect data outside of the database and store it in a time series backend. This allows for more efficient data collection, long term trend analysis, and more advanced alerting without placing additional load on the database. For production environments, metrics are typically used as the primary monitoring method, with SQL queries used as a supplemental tool.
How MetricFire Can Help
For teams that need more than lightweight availability checks, MetricFire provides a fully managed monitoring platform built on Graphite and Grafana.
Instead of querying the database directly, metrics can be collected using agents such as Telegraf and sent to Hosted Graphite. This includes signals like query rate, latency, connections, and resource usage. Because metrics are collected outside of the database, this approach reduces load on production systems and allows for more scalable monitoring. Grafana dashboards can then visualize these metrics and trigger alerts based on long term trends and real time conditions.
MetricFire removes the need to manage monitoring infrastructure, making it easier to move from simple availability checks to a more complete monitoring strategy as your system grows.
Conclusion
Monitoring database availability with Grafana can be as simple as connecting directly to your database and using SQL queries to track basic health signals such as connectivity, active sessions, and query behavior. This approach works well for lightweight status checks and quick alerting, especially when you need immediate visibility without setting up a full monitoring pipeline. However, because these queries run directly against the database and do not store long term history, they are best suited for simple use cases rather than continuous production monitoring. As systems grow, metrics-based monitoring becomes more reliable, allowing you to track trends over time, reduce database load, and build more advanced alerting logic.
By starting with direct SQL queries and evolving toward a metrics-driven approach, teams can balance simplicity with scalability. Tools like MetricFire make this transition easier by providing a managed platform for collecting, visualizing, and alerting on database metrics without additional infrastructure overhead.
FAQs
How often should Grafana query my database for availability checks?
For simple availability monitoring, a query interval of 30 seconds to 1 minute is usually sufficient. This provides near real-time visibility without putting unnecessary load on the database. Running queries too frequently can impact performance, especially in production environments, so it is important to balance responsiveness with overhead.
Source:
https://grafana.com/docs/grafana/latest/datasources/mysql/
What happens if Grafana stops receiving data from a SQL query?
If Grafana stops receiving data from a query, it can indicate that the database is unreachable or the query failed. This is why it is important to configure alert rules to treat “no data” and “error” states as alert conditions. This ensures that connectivity issues are detected quickly and surfaced to your team.
Source:
https://grafana.com/docs/grafana/latest/alerting/
When should I switch from SQL queries to metrics-based monitoring?
Direct SQL queries are useful for lightweight monitoring and quick availability checks, but they are not ideal for long term or large scale monitoring. Metrics-based systems collect data outside of the database using exporters or agents, which reduces load on the database and allows for continuous data collection over time. This makes it possible to build dashboards, analyze trends, and create more advanced alerts based on historical patterns rather than single query results.
Source:
https://grafana.com/docs/grafana/latest/datasources/mysql/
Sign up for the free trial, and experiment with monitoring your Heroku stack today. You can also book a demo and speak directly with the MetricFire team about your monitoring needs.

