Table of Contents
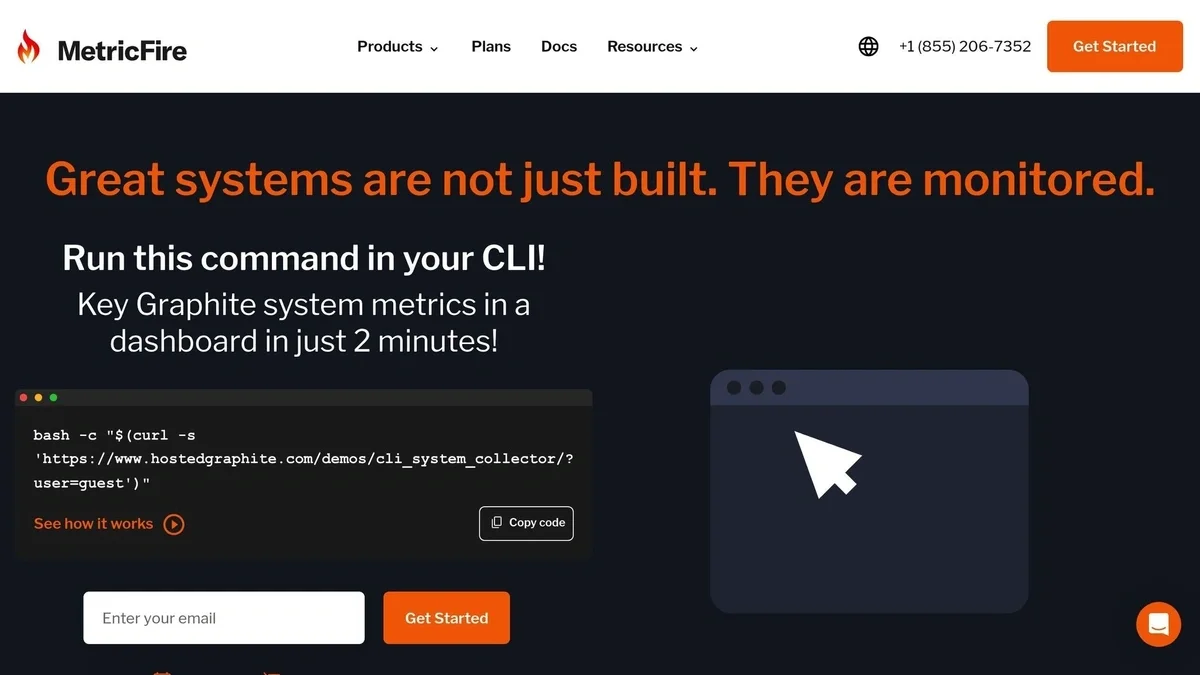
Great systems are not just built. They are monitored.
MetricFire runs Graphite and Grafana as a fully managed service for small engineering teams, taking care of storage, scaling, and version updates so your team doesn't have to. Plans start at $19/month, billed per metric namespace rather than per host, and include engineer-staffed support. Integrations work natively with Heroku, AWS, Azure, and GCP, and data is stored with 3× redundancy in SOC2- and ISO:27001-certified data centres.
Introduction
Large networks of physical infrastructure are relied on by utilities. Smart meters, substations, pipelines, field equipment, and related infrastructure over a large geographic area. Many of these assets are now sending telemetry data via IoT systems and, in practice, the data is used to track things such as energy usage, equipment health, outages and system performance. The difficult part is not getting the data as most utilities have that in place. The challenge is making it visible and actionable for operations teams.
IoT monitoring tools help utility companies turn raw telemetry into dashboards, alerts, and trends that support real day-to-day decisions. This can include identifying failing equipment before it causes an outage, understanding load patterns across the grid, or spotting abnormal behavior in remote assets.
In this article, we compare five platforms that utilities commonly evaluate: MetricFire, AWS IoT Device Management, IBM Watson IoT, Datadog, and Microsoft Azure IoT Central. We focus on how each tool supports monitoring, alerting, scalability, and integration with existing systems.
Quick Comparison
| Platform | Best for | Main strength | Main tradeoff | Pricing style |
|---|---|---|---|---|
| MetricFire | Teams that want fast time series monitoring | Hosted Graphite and Grafana with simple setup | Not a full IoT device management platform | Starts at $16 per month |
| AWS IoT Device Management | Large AWS based deployments | Strong device management and cloud integrations | More technical overhead | Usage based |
| IBM Watson IoT | Enterprise asset and maintenance use cases | Predictive maintenance and enterprise tooling | More complex setup | Custom and enterprise oriented |
| Datadog | Observability across apps, infra, and telemetry | Strong dashboards, alerting, and integrations | Can get expensive at scale | Usage based |
| Azure IoT Central | Microsoft centric organizations | Managed platform with templates and Azure integrations | Best fit if you are already in Azure | Per device tiers |
Each platform solves a slightly different problem. Some are built for device management. Some are stronger at analytics. Some work best as monitoring layers on top of existing systems. MetricFire is ideal for utilities seeking cost-effective monitoring with open-source tools, especially when comparing in-house solutions with MetricFire. AWS and Azure excel in large-scale operations and advanced analytics. IBM Watson IoT offers powerful predictive maintenance features, while Datadog provides comprehensive observability across multi-cloud environments.
1. MetricFire
Real-Time Monitoring
MetricFire offers a hosted monitoring platform built on Graphite and Grafana, two open-source tools tailored for handling time-series data. For utility companies managing IoT devices, this means you can monitor metrics from smart meters, transformers, and grid sensors without building custom infrastructure. The platform integrates with the Telegraf agent's MQTT Consumer input plugin, which is lightweight middleware for forwarding device data to MetricFire's public carbon endpoint for data storage.
Alerting Features
Alerting is based on threshold conditions and Graphite functions. Alerts can be routed to Slack, PagerDuty, email, or webhooks. Because alerts are tied directly to time series data, teams can build simple rules quickly, but usually requires more familiarity with Graphite query syntax. Conditional alert logic (using && and/or || operators) is also possible with their Composite Alerting feature.
Scalability
MetricFire's platform easily scales to handle increases in data volume. For example, Coveo expanded its metric count by more than 10x with no additional effort. Maxime Audet, Cloud-Ops Team Lead at Coveo, shared:
"We now have over ten times the amount of metrics we started with... scaling to support this increase has been hassle-free, requiring no additional work on our side."
Jim Davies, Head of DevOps at MoneySuperMarket.com, also highlighted MetricFire's scalability:
"As MetricFire scales effortlessly, we can push and store more metrics than we really need today but might need tomorrow. This increases our depth of understanding of the systems that we run and heads off any future problems."
MetricFire handles scaling on the backend, so teams do not need to manage storage clusters or retention policies themselves. It is designed for high cardinality metric environments, which is useful when tracking many devices or endpoints. It is not a device management platform, so scaling refers to metric volume rather than device lifecycle operations.
Utilities Focus
MetricFire is best used as a monitoring layer and it does not replace IoT platforms that handle provisioning or firmware updates. Instead, it complements them by visualizing and alerting on telemetry once data is already flowing.
Pricing
MetricFire uses a simple pricing model based on unique time-series metric names - one metric equals one metric. For utilities managing 250,000 custom metrics, this predictable pricing avoids the steep per-metric charges often seen with other platforms. Business-ready Hosted Graphite and Grafana services start at $16/month, offering unlimited users, integrations, and dashboard sharing at no extra cost. Itai Yaffe, Big Data Developer at Nielsen, praised this transparency:
"There's complete transparency with everything MetricFire do which means we can accurately predict what we'll be spending and comfortably keep within our budget."
You can try MetricFire for free at Hosted Graphite or schedule a demo at MetricFire to see how it can streamline your infrastructure monitoring.
2. AWS IoT Device Management
Real-Time Monitoring
AWS IoT Device Management provides visibility into device state, connectivity, and metadata across large fleets. It works alongside AWS IoT Core, where devices publish telemetry using MQTT. Data can be routed into services like CloudWatch, Kinesis, or S3 for further processing and visualization. This makes it flexible, but also means monitoring is often assembled from multiple AWS services rather than a single interface.
With AWS IoT Events, the platform identifies equipment states and triggers automated responses to operational anomalies using the best tools for monitoring IoT devices - like detecting gearbox vibrations in wind turbines or temperature spikes in solar panels.
Alerting Features
Alerting is typically handled through integrations with CloudWatch and Amazon SNS. Teams can trigger notifications or automated workflows using Lambda when certain conditions are met. AWS IoT Events can also be used to detect patterns or state changes in device data, which is useful for operational scenarios like fault detection.
Scalability
AWS is built for large scale deployments. It supports bulk provisioning, device registries, and grouping features that allow teams to organize and manage large fleets. Scaling is one of its strongest areas, but it also introduces complexity. Most setups require some level of infrastructure design.
Utilities-Specific Integrations
AWS supports industrial protocols through gateways and edge services like IoT Greengrass. This is important for utilities working with legacy systems that do not natively speak modern cloud protocols. It also integrates well with data pipelines for analytics, which can support use cases like demand forecasting or anomaly detection.
Pricing
Pricing is usage based across multiple services. Costs depend on message volume, rules processing, storage, and downstream services. This gives flexibility, but it can be difficult to estimate total cost without a clear architecture. Many teams complain about runaway costs that can come unexpectedly.
3. IBM Watson IoT
Real-Time Monitoring
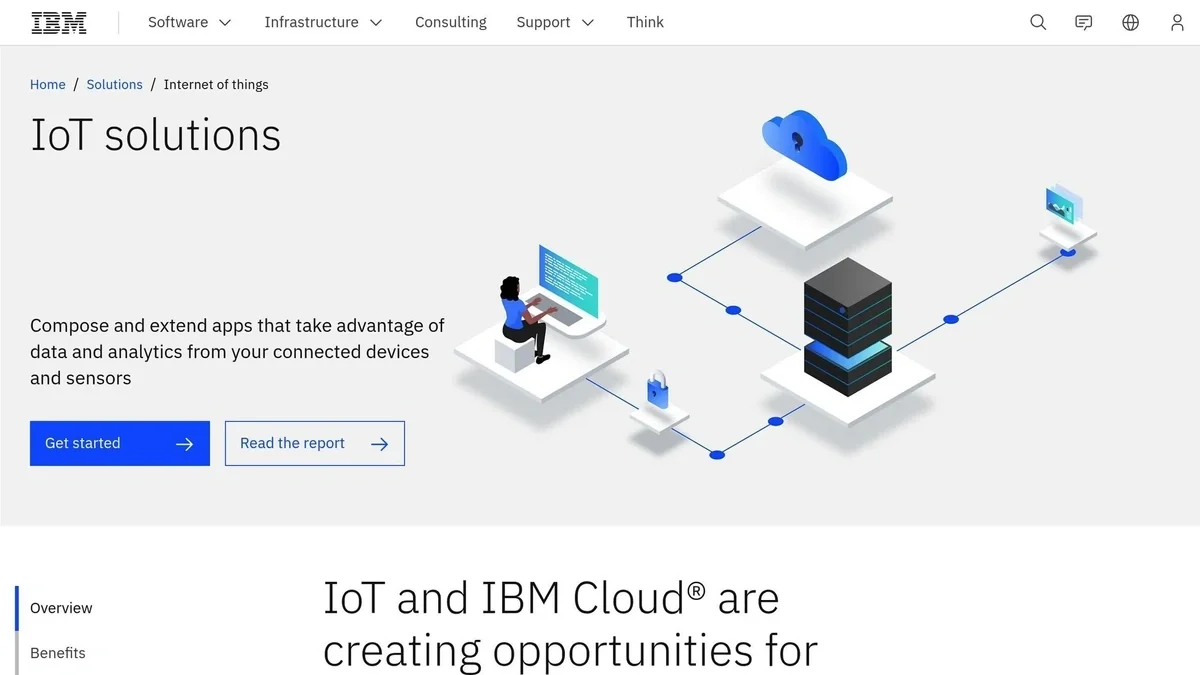
IBM Watson IoT uses an event driven model where devices send data through MQTT or HTTP. It is often used alongside IBM Maximo, which adds context around assets and maintenance workflows. This setup allows teams to monitor both device telemetry and the operational state of physical equipment.
Alerting Features
The platform includes rule based triggers that respond to incoming events. These rules can initiate actions such as notifications, workflows, or integrations with other IBM services. Alerting is typically tied to asset conditions rather than just raw metric thresholds.
Scalability
IBM Watson IoT is designed for enterprise environments. It supports large numbers of connected devices, especially when combined with IBM’s broader cloud and asset management tools. Scaling is usually handled as part of a larger IBM architecture rather than a standalone deployment.
Utilities-Specific Integrations
Its main strength is asset heavy environments. Utilities that prioritize maintenance planning, inspections, and lifecycle tracking may benefit from its integration with Maximo. It is less focused on lightweight telemetry dashboards and more on operational workflows.
Pricing
Pricing is typically tied to enterprise contracts and usage. It is not positioned as a low cost or quick start solution.
4. Datadog
Real-Time Monitoring
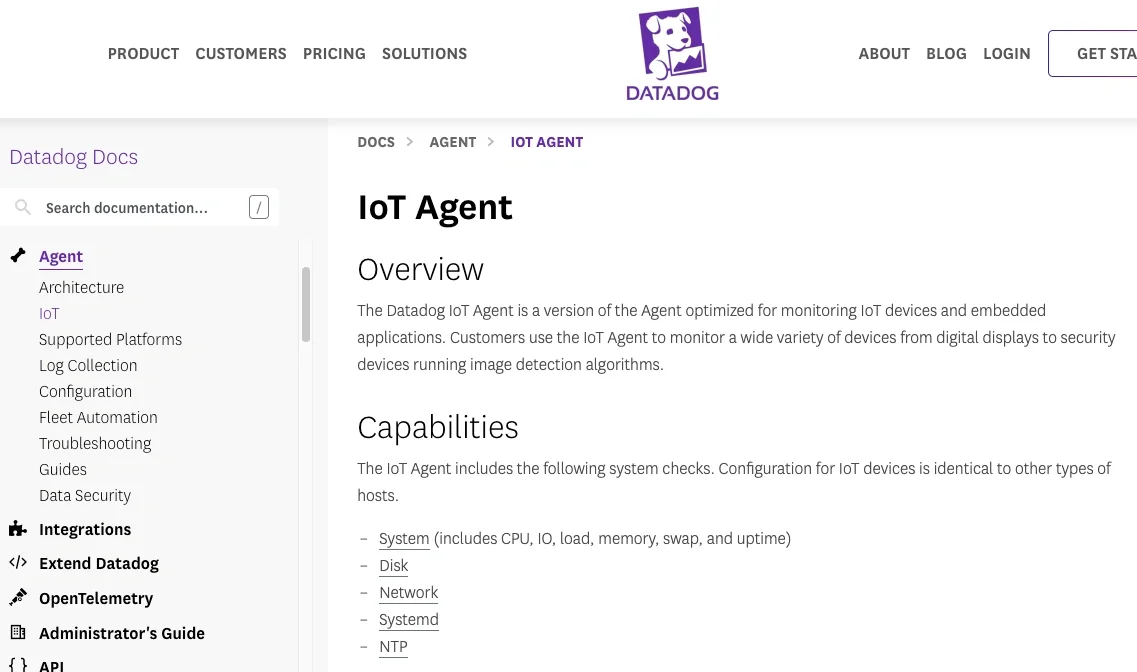
Datadog collects metrics, logs, and traces through its agent and integrations. They have their own IoT agent and typically ingest device data from gateways, cloud services, or APIs rather than directly from constrained devices. This makes it useful for monitoring the systems around IoT rather than acting as the device platform itself.
Alerting Features
Alerting is one of Datadog’s strongest areas. Teams can define monitors based on metrics, logs, or composite conditions. Alerts can be routed to common incident management tools and can include built in noise reduction features.
Scalability
Datadog is designed for large scale observability across infrastructure and applications. It handles high volumes of telemetry, but cost tends to scale with usage. Its Flex Logs feature allows organizations to query high-cardinality IoT data for up to 15 months without requiring external storage. The platform also supports over 1,000 integrations with pre-built dashboards and monitors, making it highly adaptable.
Utilities-Specific Integrations
Datadog is not a utilities specific platform, but it integrates well with cloud services that utilities often use. It is especially helpful when IoT data needs to be viewed alongside backend services, APIs, and infrastructure.
Pricing
Pricing is usage based across metrics, logs, and other data types. Costs can increase quickly if large volumes of telemetry are ingested without filtering.
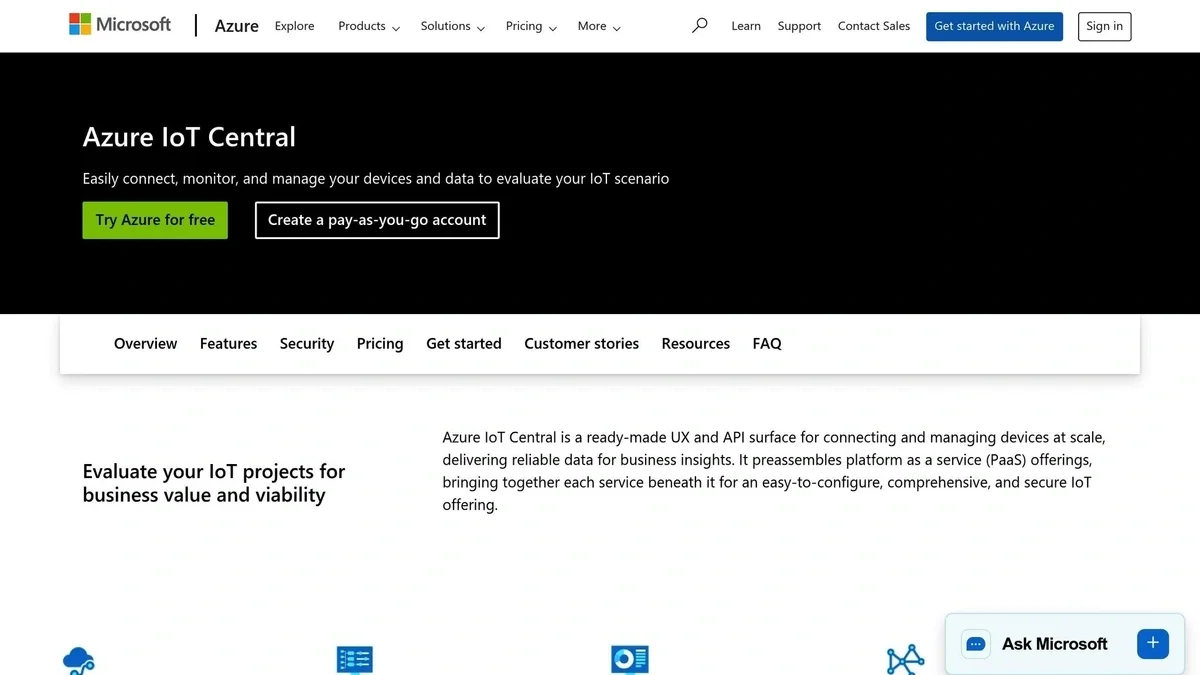
5. Microsoft Azure IoT Central
Real-Time Monitoring
Azure IoT Central provides dashboards and device views out of the box. Devices connect through Azure IoT Hub, and telemetry can be visualized without building custom pipelines. This makes it easier to get started compared with more modular platforms.
As Charles Alshuler, Director of Sales Operations at Clean Energy, explained:
"Our teams in the field can predictably perform processes and repairs, capturing the data via IoT".
Alerting Features
Users can define rules that trigger actions when telemetry meets certain conditions. These actions can include notifications, integrations, or automated workflows through other Azure services.
Scalability
Azure IoT Central is designed to scale with large device fleets. Much of the underlying infrastructure is managed by Azure, which reduces operational overhead. For more advanced scenarios, data can be exported to services like Azure Data Explorer or Data Lake.
Utilities-Specific Integrations
Azure offers templates and integrations that are relevant to energy and utility use cases. It also supports mapping and geographic visualization through Azure Maps, which can help with grid level visibility.
Pricing
Pricing is based on device tiers and message volume. This provides a clearer starting point than some usage based models, but total cost still depends on how frequently devices send data. The first two devices are free, while subsequent tiers are priced as follows:
- Tier 0: $0.08/device/month for up to 400 messages
- Tier 1: $0.40/device/month for up to 5,000 messages
- Tier 2: $0.70/device/month for up to 30,000 messages
Conclusion
Utility companies do not adopt IoT just to collect data. They use it to operate and maintain critical infrastructure more effectively. In practice, that means monitoring equipment health across large networks, detecting issues early, and understanding how systems behave over time. Some platforms focus on managing devices and connectivity while others focus on making telemetry easier to visualize and act on.
AWS IoT Device Management and Azure IoT Central are better suited for organizations that need to manage large fleets of devices and integrate deeply with cloud services. IBM Watson IoT is more aligned with asset management and maintenance workflows. Datadog fits best when IoT data needs to be viewed alongside applications and infrastructure.
MetricFire plays a different role by focusing on affordable time series monitoring, dashboards, and alerting. For utilities that already have data flowing from meters, gateways, or cloud systems, it provides a simpler way to make that data useful without managing additional infrastructure.
The right choice depends on how your systems are set up today and what problem you are trying to solve. For many utilities, the most effective approach is not a single platform, but a combination of tools that handle device management, data processing, and monitoring separately.
IoT FAQs
1: How can utilities estimate the volume of IoT data from smart meters and sensors?
The total volume depends on three main factors: the number of devices, how often each device reports data, and how many metrics are included in each message. For example, a single smart meter reporting every 15 minutes produces 96 readings per day. At scale, this adds up quickly across thousands or millions of devices. Many utilities reduce volume by aggregating data at the edge or sending only meaningful changes instead of every raw reading.
Source:
https://learn.microsoft.com/en-us/azure/architecture/example-scenario/iot/iot-architecture-overview
2: What is the difference between IoT device management and IoT monitoring?
IoT device management focuses on controlling devices. This includes provisioning, authentication, firmware updates, and organizing device fleets. IoT monitoring focuses on telemetry. This includes collecting metrics, visualizing trends, and alerting on abnormal behavior. Most utilities use both. A platform like AWS IoT or Azure IoT Central handles device management, while tools like MetricFire or Datadog are often used to monitor the data those devices produce.
Source:
https://docs.aws.amazon.com/iot/latest/developerguide/iot-device-management.html
3: How do utilities integrate legacy systems with modern IoT platforms?
Many utilities still rely on industrial protocols such as Modbus, DNP3, and OPC UA. These systems were not designed for cloud connectivity. A common approach is to use gateways or edge devices that translate legacy protocols into modern ones such as MQTT or HTTP. Platforms like AWS IoT Greengrass and Azure IoT Edge support this pattern, allowing older equipment to send data into cloud systems without replacing the hardware.
Source:
https://learn.microsoft.com/en-us/azure/iot-edge/about-iot-edge
4: What should utilities look for in an IoT monitoring platform?
The most important factors are usually:
- Ability to handle high volumes of time series data
- Integration with existing cloud or on prem systems
- Clear alerting and visualization tools
- Pricing that scales predictably with data volume
In practice, the right choice depends more on your existing stack and team experience than on feature lists alone.
Source:
https://docs.datadoghq.com/getting_started/
5: How can utilities reduce unnecessary IoT data without losing visibility?
Sending every raw data point is rarely necessary. Many systems reduce noise by:
- Aggregating data at the edge
- Sending only changes or threshold breaches
- Filtering low value metrics before ingestion
This approach helps control storage costs and makes dashboards and alerts more meaningful.
Source:
https://learn.microsoft.com/en-us/azure/architecture/guide/iot/iot-solution-architecture
Sign up for the free trial and begin monitoring your infrastructure today. You can also book a demo to speak with the MetricFire team directly about your monitoring needs.


