
Table of Contents
- Introduction
- Key Takeaways
- Understanding the 502 Bad Gateway Error
- What is PHP-FPM used for?
- Common Causes and Solutions - 1. PHP-FPM Service Not Running - 2. NGINX Unable to Connect to PHP-FPM - 3. PHP-FPM Timeout Settings - 4. Resource Limitations - 5. Firewall or Security Software Interference - 6. DNS Resolution Issues
- Possible reasons for 502 Bad Gateway
- Proactive Monitoring with Histed Graphite by MetricFire
- How to solve the 502 error?
- Monitoring your system metrics with Hosted Graphite by MetricFire
- Conclusion
Introduction
Encountering a 502 Bad Gateway error when using NGINX with PHP-FPM can be frustrating. This guide delves into the common causes of this error and provides actionable steps to diagnose and resolve the issue effectively.
NGINX Error 502 Bad Gateway is a standard error among website users. There are various possible reasons for this error and different ways to solve it. In this article, we will look at the leading possible causes and how users and web developers can solve them.
To prevent and troubleshoot NGINX 502 Bad Gateway errors caused by PHP-FPM, it's crucial to have real-time visibility into your server’s performance—learn how monitoring NGINX with Telegraf or OpenTelemetry can help you detect and resolve issues before they impact users:
- Step-by-Step Guide to Monitoring Your NGINX Webservers with Telegraf
- Monitor NGINX Performance with OpenTelemetry.
Use MetricFire's platform to analyze your system’s performance and troubleshoot errors. Book a demo with our team for more detailed information about MetricFire and how to integrate it with your system; sign up for a MetricFire free trial, or read more about monitoring your NGINX webserver with Telegraf here.
Key Takeaways
- NGINX Error 502 Bad Gateway is an error message that indicates the server is receiving an error from another server and cannot connect to PHP-FPM, or PHP-FPM is not responding.
- The use of PHP-FPM with NGINX can improve the performance of websites and reduce resource consumption.
- Some possible reasons for the error are non-running NGINX or PHP-FPM, firewall blocking requests, the domain name not being allowed, or the server being unavailable.
- To solve the error, website visitors can reload the page, clear the browser cache and delete cookies, try using a different browser, or restart the router.
- MetricFire's platform can monitor NGINX statuses, and its Telegraf plugin allows users to visualize their NGINX server's status and 502 errors.
Understanding the 502 Bad Gateway Error
A 502 Bad Gateway error indicates that NGINX, acting as a reverse proxy, received an invalid response from an upstream server—in this case, PHP-FPM. This typically means that NGINX was unable to establish a successful connection with PHP-FPM or that PHP-FPM failed to respond appropriately
502 Bad Gateway means that the server you are accessing receives an error from another server. This happens when one server acts as a proxy to receive information from another. When connecting to another server, it returns an error. NGINX returns error 502 if it cannot connect to PHP-FPM or PHP-FPM is not responding.
There are different names for the 502 error that you can see on different sites. For example:
- HTTP Error 502 - Bad Gateway.
- HTTP 502.
- 502 Service Temporarily Overloaded.
- Temporary Error (502).
- 502 Bad Gateway NGINX.
- 502 Bad Gateway.
- Error 502.
- 502 Proxy Error.
Also, the page's appearance that displays the 502 error can be customized on different sites in the same way as it is done for the 404 not found error. There are various causes of error 502. Below, we will examine the main ones and possible ways to fix this error.
What is PHP-FPM used for?
PHP-FPM (PHP-FastCGI Process Manager) is a web request processing tool for PHP applications. With NGINX, PHP-FPM can significantly increase website performance and reduce resource consumption.
If you are using PHP-FPM, PHP works as an isolated service. Web requests are processed over a TCP/IP socket, NGINX only handles HTTP requests, and PHP-FPM interprets PHP code. The use of separate services is essential to improve efficiency.
Common Causes and Solutions
1. PHP-FPM Service Not Running
If PHP-FPM isn't running, NGINX cannot forward requests to it, resulting in a 502 error.metricfire.com+2metricfire.com+2metricfire.com+2
Check PHP-FPM Status:
systemctl status php-fpm
If the service is inactive, start it:
sudo systemctl start php-fpm
2. NGINX Unable to Connect to PHP-FPM
Misconfigurations in NGINX can prevent it from connecting to PHP-FPM.metricfire.com+2metricfire.com+2metricfire.com+2
Verify NGINX Configuration:
Ensure that the fastcgi_pass directive in your NGINX configuration matches the PHP-FPM listening address. For example:
location ~ \.php$ {
    include fastcgi_params;
    fastcgi_pass 127.0.0.1:9000;
    fastcgi_index index.php;
    fastcgi_param SCRIPT_FILENAME $document_root$fastcgi_script_name;
}
If PHP-FPM is configured to listen on a Unix socket, adjust accordingly:
fastcgi_pass unix:/run/php/php7.4-fpm.sock;
3. PHP-FPM Timeout Settings
Long-running PHP scripts may exceed the timeout settings, causing PHP-FPM to terminate the process prematurely.metricfire.com+1metricfire.com+1
Adjust Timeout Settings:
In your PHP-FPM pool configuration (e.g., /etc/php/7.4/fpm/pool.d/www.conf), consider increasing the request_terminate_timeout value:
request_terminate_timeout = 60s
Also, ensure that NGINX's fastcgi_read_timeout is set appropriately in your server block:
fastcgi_read_timeout 60s;
4. Resource Limitations
High server load or insufficient resources can cause PHP-FPM to become unresponsive.
Monitor Server Resources:
Use tools like top, htop, or vmstat to monitor CPU and memory usage. If resources are maxed out, consider optimizing your application, upgrading server resources, or implementing caching mechanisms.
5. Firewall or Security Software Interference
Firewalls or security software may block communication between NGINX and PHP-FPM.
Check Firewall Settings:
Ensure that the necessary ports (e.g., 9000 for PHP-FPM) are open and not blocked by firewall rules.
6. DNS Resolution Issues
If NGINX is configured to connect to PHP-FPM using a hostname, DNS resolution failures can lead to 502 errors.
Test DNS Resolution:
Use the dig or nslookup commands to verify that the hostname resolves correctly.
Possible reasons for 502 Bad Gateway
Let’s take a look at some of the possible reasons for the 502 Bad Gateway.
NGINX is not running
If you see error 502, check if NGINX is running. To do this, run the following command:
systemctl status nginx
If, in the response, you see that the status is inactive (dead), then you need to start NGINX.
PHP-FPM is not running
The following reason for the 502 error is that PHP-FPM is not running. If you are on Linux, you can check if PHP-FPM is running using the following command:
ps aux | grep php-fpm
If no PHP-FPM processes are displayed due to this command, you must run PHP-FPM to resolve error 502.
PHP-FPM timeout expires
If the server takes too long to respond, a 502 error can be caused by a PHP-FPM timeout. In this case, PHP-FPM closes the connection before the response is sent, and NGINX returns a 502 error. To fix this problem, you can increase the PHP-FPM timeout, or you will have to research your application and figure out why it has not responded for too long.
Firewall blocks requests
A firewall can block communication between the edge servers and the origin server. Some DDoS protection systems or your CMS's security plugins can block server requests.
A domain name is not allowed.
The domain name is not resolved to the specified IP address or all IP addresses. In this case, you need to change the DNS server and wait until the changes are propagated and become active globally.
Server is unavailable
The original server is down, or there is no connection to this server.
Proactive Monitoring with Histed Graphite by MetricFire
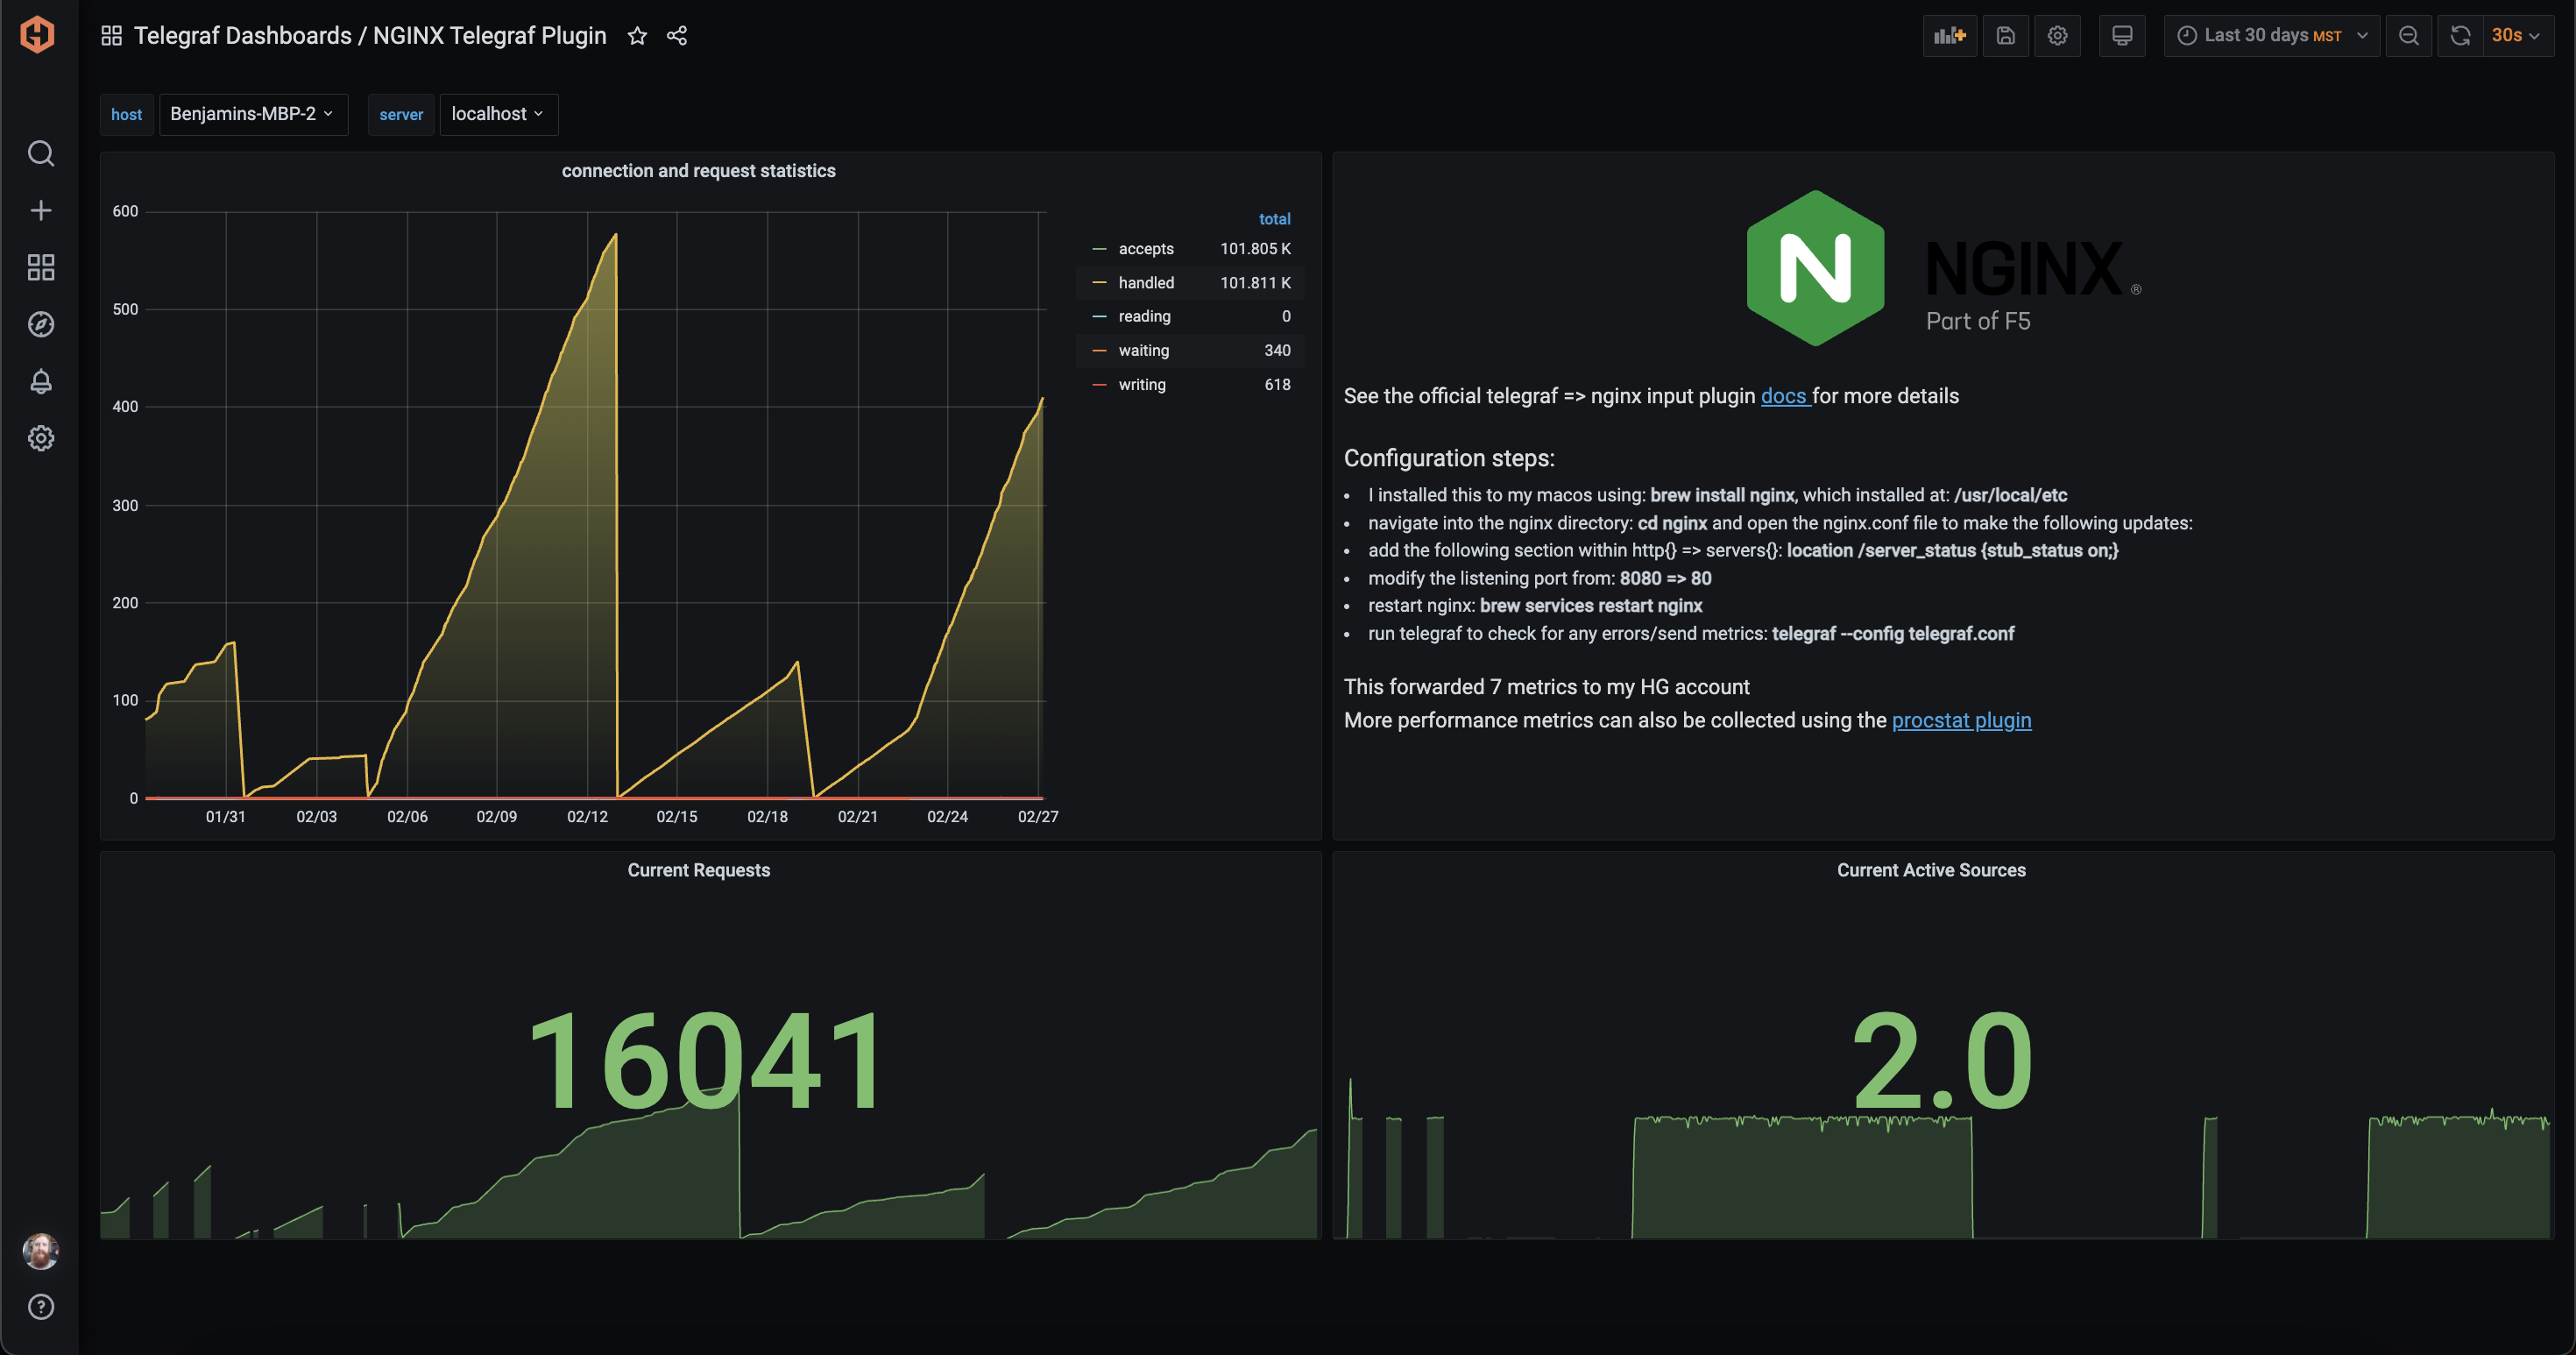
Did you know you can visualize your NGINX statuses with MetricFire? MetricFire ingests time-series metrics, so as long as your metrics are sent in a format Graphite can ingest, we use a Telegraf NGINX plugin to integrate NGINX with MetricFire. With this agent, you can see the 502 errors and the status of your NGINX servers. To get better insights and solve the 502 errors in your NGINX servers, sign up for a MetricFire 14-day free trial and then follow our tutorial to start sending NGINX data to your account.
How to solve the 502 error?
Most often, the 502 error occurs due to problems on the side of the website. However, there are times when the cause is in the user’s device. You can check if you only have connection problems or if other people cannot establish a connection to this website. To do this, use one of the tools that check the site's status and whether it is working. For example, use one of the following tools or similar ones: isitdownrightnow.com, downforeveryoneorjustme.com. To learn more about the cause of error 502, you can examine the NGINX log file on your computer (/var/log/nginx/error.log).
As visitor
If you are the only one experiencing connectivity issues, there are several things you can do as a website visitor to resolve the 502 error.
- Reload the page in the browser. The 502 error is often temporary, and a simple reboot can help.
- Clear browser cache and delete cookies. The browser can save old or corrupted files and data that can cause the 502 error.
- Try using a different browser. The error may occur in the specific browser you are using, and it will not occur in another browser.
- Restart your computer and network equipment. Perhaps this is the problem, and the error will disappear after a reboot.
- Check plugins and extensions in your browser. If you use any plugins or extensions and the website works in another browser, they may block the connection. Disable all installed plugins and extensions and recheck the connection.
- Change your DNS server. Changing the DNS server may resolve the 502 error. You can choose Open DNS or Google DNS servers.
As developer
In most cases, error 502 occurs for all users because the problem is on the website. As a web developer, you can do the following:
- Check if your server is available.
- Check the firewall logs for unusual crashes.
- If you are using Cloudflare, your visitors may receive a 502 Bad Gateway error when a certain limit is reached. Try to disable Cloudflare.
Monitoring your system metrics with Hosted Graphite by MetricFire
Implementing robust monitoring can help detect and address issues before they escalate.
Utilize MetricFire's Monitoring Tools:
MetricFire offers tools like Telegraf and OpenTelemetry to monitor NGINX and PHP-FPM performance metrics. By setting up real-time dashboards and alerts, you can proactively manage your server's health and respond swiftly to anomalies.
To identify bottlenecks and troubleshoot errors such as error 502, it is helpful to monitor the metrics of your system and the technologies you are using in your application. MetricFire has an open-source platform that provides the tools to monitor and analyze your system’s metrics. MetricFire offers Hosted Graphite and Hosted Grafana. Grafana is a web-based analytics and data visualization application. It allows you to create customizable dashboards, including diagrams, graphs, and notifications. You can easily monitor your Nginx instance using MetricFire.
Let's take a look at some of the main features of Grafana:
- Dashboard templates. You can design your dashboard using templates as if you were writing code. With templates, you can use the same design in different environments.
- Annotations. You can create logs and comments on your chart manually or automatically.
- Custom Plugins. Grafana can install external plug-ins that allow you to expand its basic functionality.
- SQL support. With SQL support, you can easily pull data from various data sources.
- Alerts. Grafana can send users notifications about essential incidents.
Graphite is a tool for collecting, storing, and processing metrics. It can also be used as a data source for Grafana. Grafana has an advanced Graphite query editor allows you to write various queries, add functions, change function parameters, accept complex nested queries using query links, and much more.
Hosted Graphite and Grafana let you track your system performance in real time. MetricFire offers hosting services for both tools, allowing you to focus on your system’s performance and monitor its metrics in your browser.
Sign up for the free trial, and experiment with monitoring your NGINX instances using the Telegraft agent today. You can also book a demo and talk to the MetricFire team directly about your monitoring needs.
Conclusion
A 502 Bad Gateway error in NGINX when using PHP-FPM is often a symptom of underlying issues such as service downtime, misconfigurations, or resource constraints. By systematically diagnosing and addressing these potential causes, and by implementing proactive monitoring solutions like those offered by MetricFire, you can ensure the reliability and performance of your web applications.
Book a demo with MetricFire experts or sign up for the free trial today to learn more about our features.

