
Explore insightful articles, tutorials, and updates on MetricFire’s blog. Stay informed about the latest trends in monitoring, cloud services, and best practices for optimizing your infrastructure and applications.

Troubleshoot high disk usage: causes like log growth, Windows Search, SysMain, fragmentation, and bad... Continue Reading

Monitor 10 essential Kubernetes metrics—node/pod CPU & memory, API server and etcd latencies, kubelet,... Continue Reading
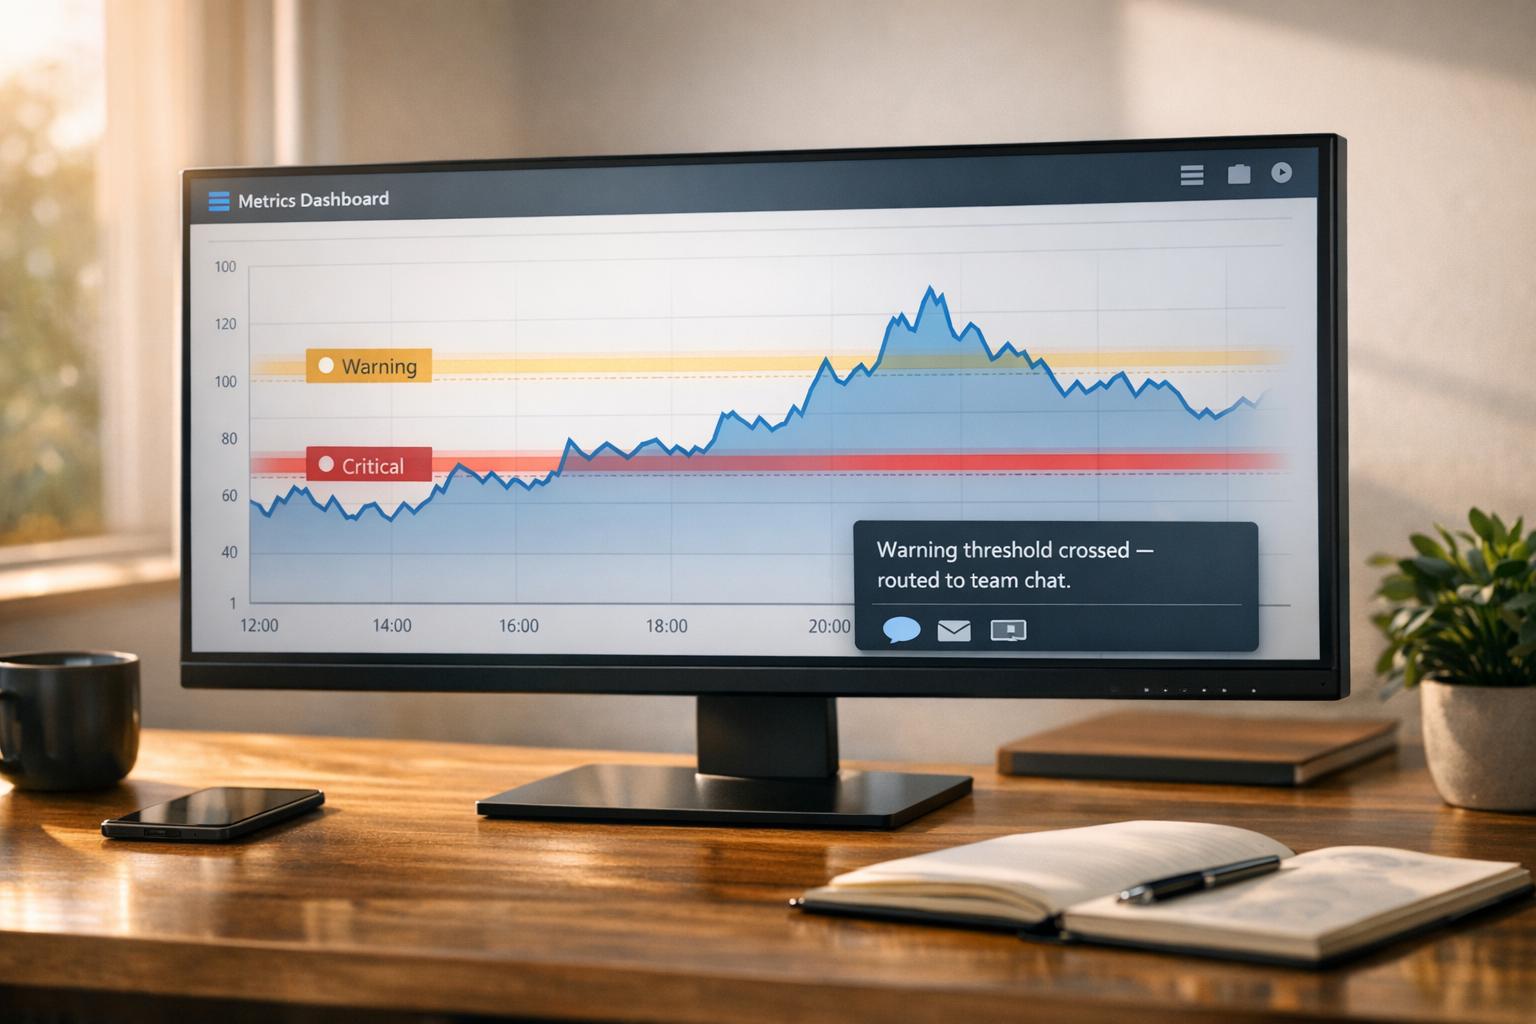
Set warning and critical thresholds, cut false positives with smoothing and hysteresis, and route... Continue Reading

Learn how to configure and secure Grafana custom webhooks, customize JSON payloads with templates,... Continue Reading
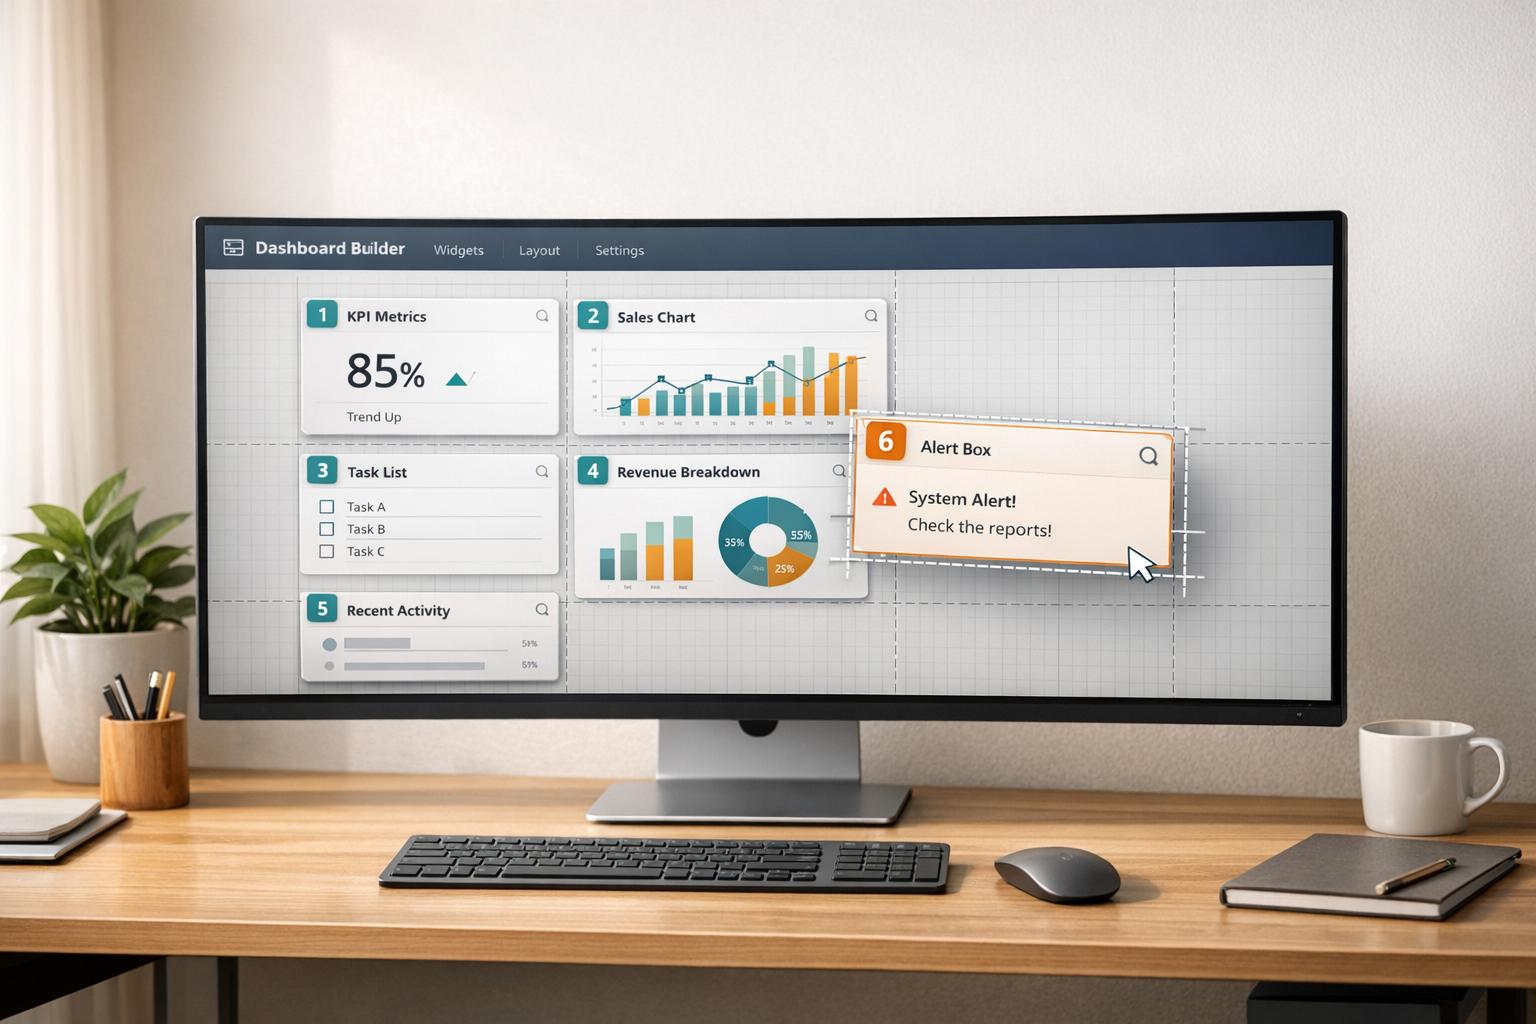
Step-by-step guide to build custom Grafana dashboards with hosted data sources: setup, panels, variables,... Continue Reading

Calculate MTTD, MTTA, and MTTR with clear formulas, examples, and benchmarks to identify monitoring... Continue Reading
SaaS monitoring usually costs less than self-hosted once you factor in labor, maintenance, and... Continue Reading

Learn best practices for designing effective Grafana dashboards to enhance incident response and streamline... Continue Reading

Explore common DevOps monitoring challenges and effective solutions for improved visibility, alert management, and... Continue Reading

Learn essential strategies for effective cloud infrastructure monitoring, focusing on performance, security, and cost... Continue Reading
