 +
+

To integrate Amazon CloudWatch and GitHub with your monitoring system, please reach out to MetricFire. Book a demo with the MetricFire team to discuss integrating Amazon CloudWatch and GitHub and how that can support your monitoring system.
Amazon CloudWatch is a management and monitoring service designed for AWS and other infrastructure resources or on-premises applications. It is the official metrics monitoring tool for Amazon Web Services. Using CloudWatch, you can access all your performance and operational metrics in a single platform, helping you overcome the challenge of monitoring multiple systems. CloudWatch helps you monitor your entire stack — including applications, infrastructure, and services — thus freeing up valuable resources to allow you to focus on building applications.
You can use CloudWatch Container Insights to monitor and troubleshoot your applications and microservices. CloudWatch collects, aggregates, and summarizes computer utilization information; like CPU and memory usage, network data history, and also monitoring diagnostic information. Container Insights provides you with details about container management services, such as Amazon ECS for Kubernetes (EKS), Amazon's Elastic Container Service (ECS), etc.
The brilliant thing about Amazon Cloudwatch is that it is your gatekeeper to data and metrics for all your Amazon applications and services. However, monitoring more than the standard set of metrics can become very expensive with CloudWatch. CloudWatch custom metrics are very expensive and they should be used sparingly. For example, if a company is monitoring its AWS systems with the standard CloudWatch dashboards, it might cost around 1000 USD a month. However, if you’re monitoring hundreds of thousands of metrics related to a new launch, AWS CloudWatch could quickly rack up to 50,000 USD a month.
That's why it's such a vital integration point for MetricFire. MetricFire treats all metrics the same, so if you’re monitoring thousands of specialized metrics, you’ll still pay the same basic rate for those metrics. CloudWatch can be integrated with MetricFire, so you can pull your AWS metrics into the MetricFire platform. Then, you can get low-cost metrics scaling, while still being able to monitor your AWS metrics all in a single pane of glass. MetricFire's advanced filtering lets you choose only the data views you want to see and discard the rest. You can also set up simple rules to discard data you no longer need to keep, plus receive alerts via email or Slack.
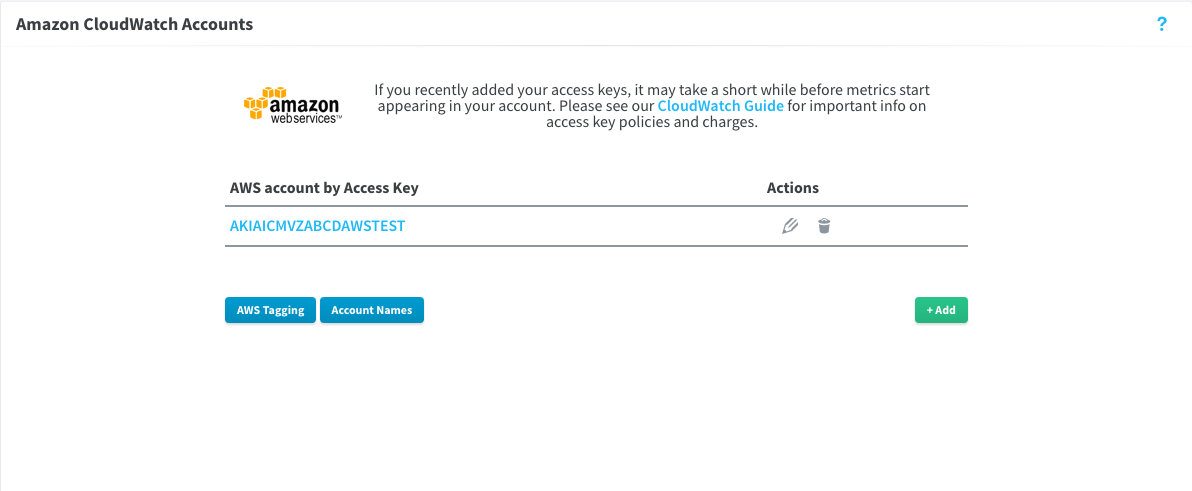
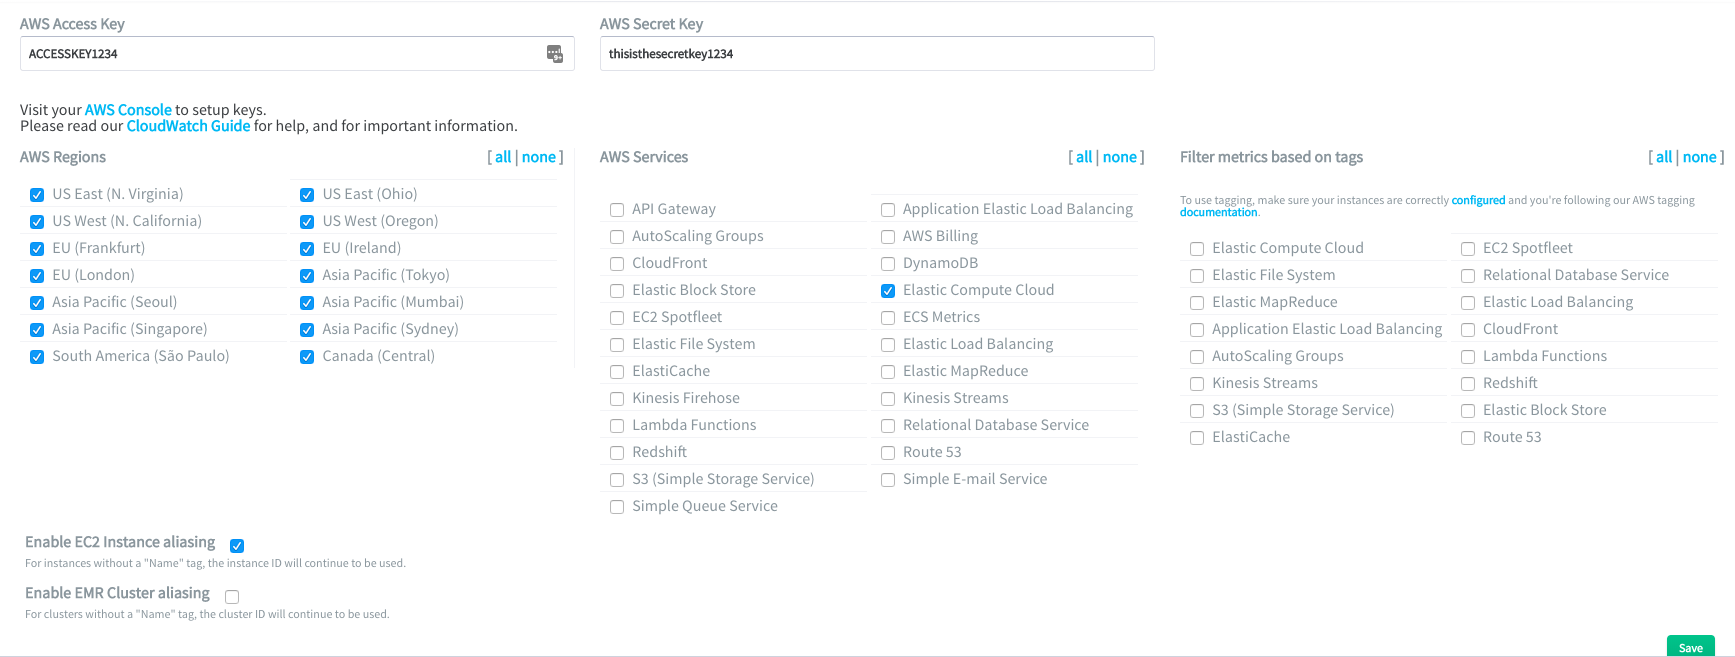
To get started, first, create a policy that we will later attach to the user.
Next, we’ll create a user to attach the policy. We’ll use the Access Key/Secret Key tokens to permit Hosted Graphite to import CloudWatch metric data.
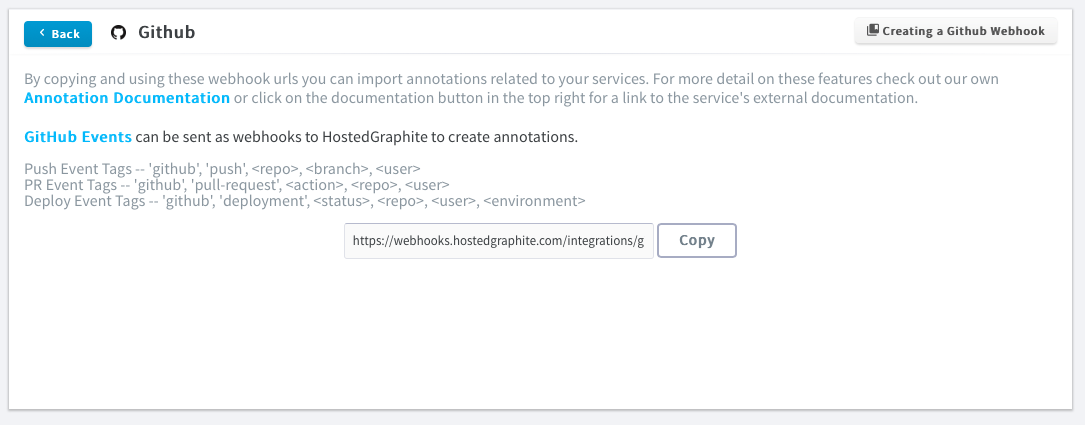
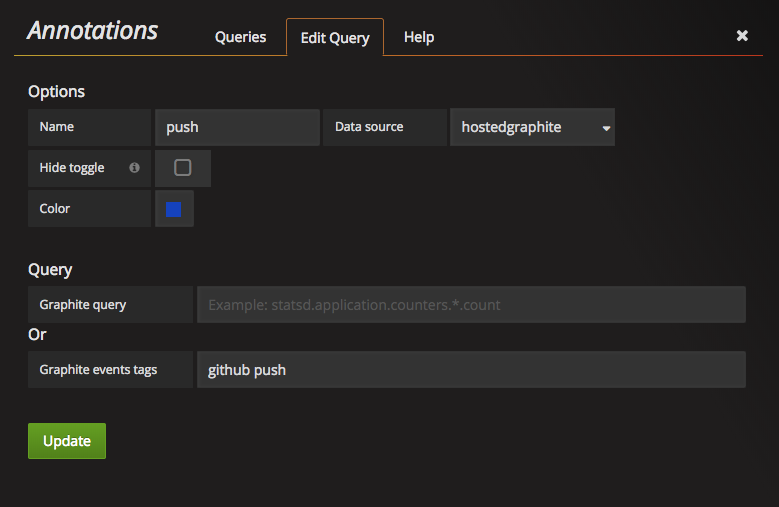
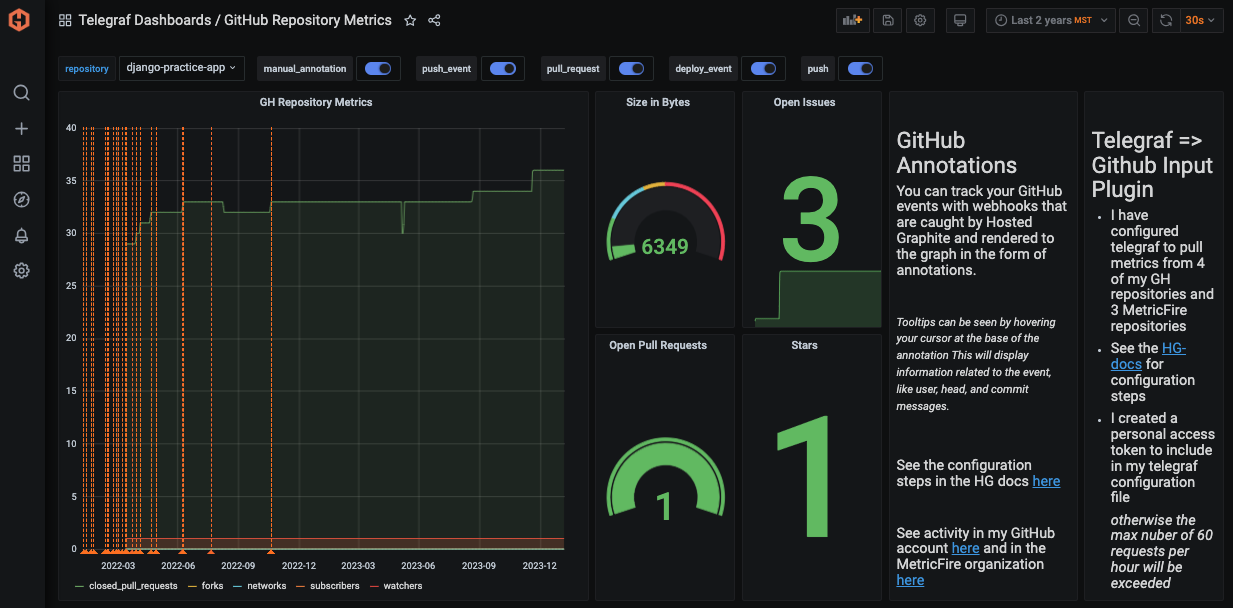
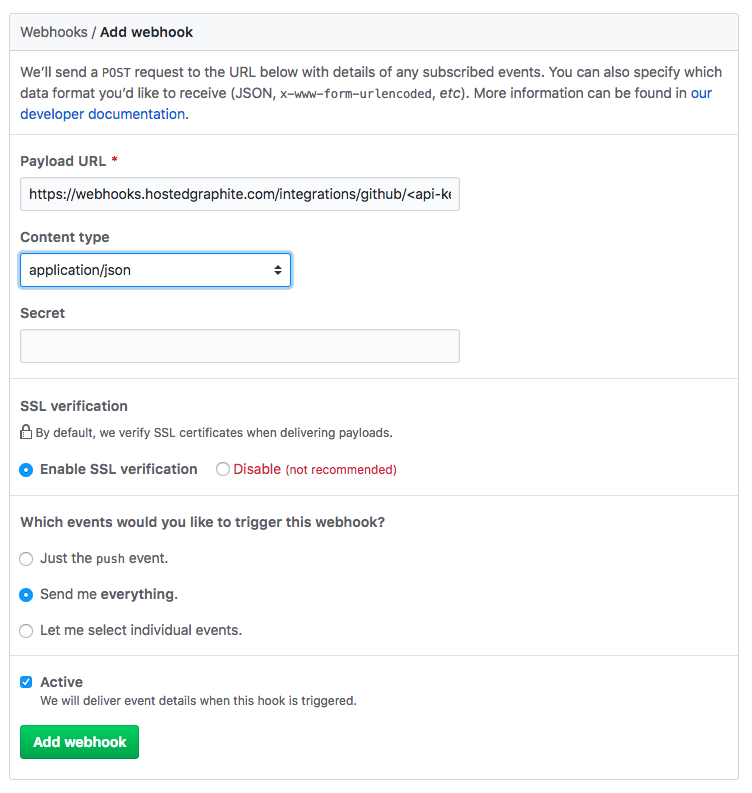
MetricFire makes it easy to collect data from your repositories, and visualize GitHub events in the form of dashboard annotations. To enable our webhook integration, copy the webhook from Add-Ons => GitHub in your Hosted Graphite account:
Then add the webhook to your GitHub repo, in the ‘settings’ section => ‘webhooks’
Additionally, there is also a Telegraf Input plugin for GitHub. This plugin will send a variety of metrics to your Hosted Graphite account for increased visibility into your repositories. See our handy blog article with detailed configuration instructions HERE, and the official GH repository HERE.
MetricFire is a full-scale platform that provides infrastructure, system, and application monitoring using a suite of open-source tools. We will aggregate and store your data as time series metrics, which can be used to build custom dashboards and alerts. MetricFire takes away the burden of self-hosting your own monitoring solution, allowing you more time and freedom to work on your most important tasks.
MetricFire offers a complete ecosystem of end-to-end infrastructure monitoring, comprised of open-source Graphite and Grafana. MetricFire handles the aggregation, storage, and backups of your data, and offers alerting, team features, and API's for easy management of your monitoring environment. You can send server metrics using one of our agents, custom metrics from within your application code, and integration metrics from a variety of popular 3rd party services that we integrate with like Heroku, AWS, Azure, GCP, and many more!
Our Hosted Graphite product has improved upon standard Graphite to add data dimensionality, optimized storage, and offers additional tools and features that provide customers with a robust and well-rounded monitoring solution.
“We now have over ten times the amount of metrics we started with, and on different accounts. One of the great things about MetricFire is that scaling to support this increase has been hassle-free, requiring no additional work on our side.”
“Building and managing an on-premise installation at this scale would require a lot of engineer time, especially in the first year...we use this engineering time to work on initiatives closer to our core business”
“There’s complete transparency with everything MetricFire do which means we can accurately predict what we’ll be spending and comfortably keep within our budget.”
"Every time I have a question, I get an answer from support after just a couple of hours. Their technical knowledge is excellent.”
Monitoring ZFS across your business's server infrastructure is crucial for ensuring data integrity, optimizing... Continue Reading